Key Takeaway: Bond and Equity fund flows data can be noisy and data points get used to support existing narratives, but best evidence shows continued investor demand for bond funds and defensive equity exposure. Low volatility and defensive sector funds look crowded.
The Financial Times newspaper recently ran a headline indicating that equity fund outflows have surpassed $100 billion for 2016. Shortly thereafter it ran a story highlighting that low volatility funds have seen inflows of $10 billion in that same time period. On the surface this seems to suggest investor aversion to equities with the exception of still-high demand for increasingly crowded defensive areas of the stock market. A closer look at the data (not just the headlines) suggests this is the case.
Rather than get preoccupied with single data points, a better approach might be to look at the trend in equity fund flows. Combined mutual fund and ETF flows have been negative in all but five weeks in 2016. Interestingly, one of those weeks was last week, when ETFs saw their largest inflow of 2016. One week does not make a trend, so it will bear watching to see if this continues as we move into June. Also important is identifying what area of the equity market is seeing inflows.
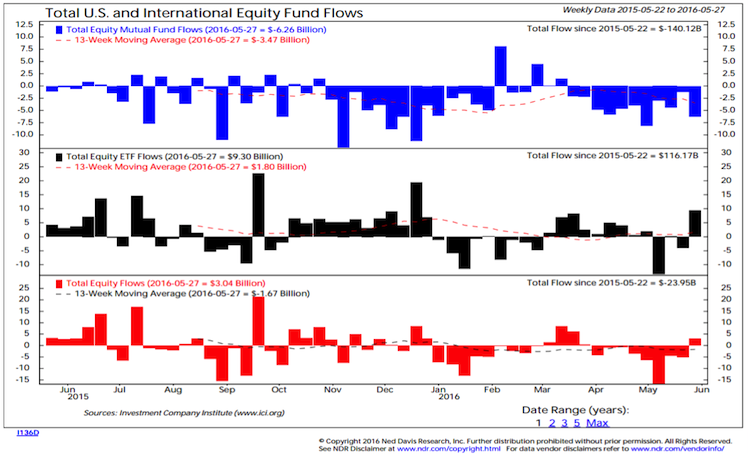
Equity mutual fund flows have had a downward bias for the past few years as investors have increasingly looked to ETFs for equity exposure. That secular tailwind makes the outflows from ETFs seen in three of the five months in 2016 that much more interesting. It is also compelling to consider where those equity flows are going. Sector-specific funds with exposure to defensive sectors like Utilities, Telecom and Consumer Staples funds have seen inflows of $6.1 billion in 2016. The remaining sector-specific funds seeing outflows of twice that amount this year.
As mentioned above, cross-sector low volatility funds have also seen inflows surge in 2016. The risk is not so much what these funds hold (they are actually more equally-weighted than the S&P 500), but more who holds them. They appear now to be in the hands of a potentially fickle crowd and are trading at historically expensive valuations.
Echoing the demand for “safety” seen in equity fund flows, bond funds (both mutual funds and ETFs) have seen consistent inflows in 2016. The inflow to bond funds reverses the outflows that were seen over the course of 2014-2015. Just as with equities, the bond fund flows point to a continuation in the long-term secular trend toward ETFs and away from mutual funds.
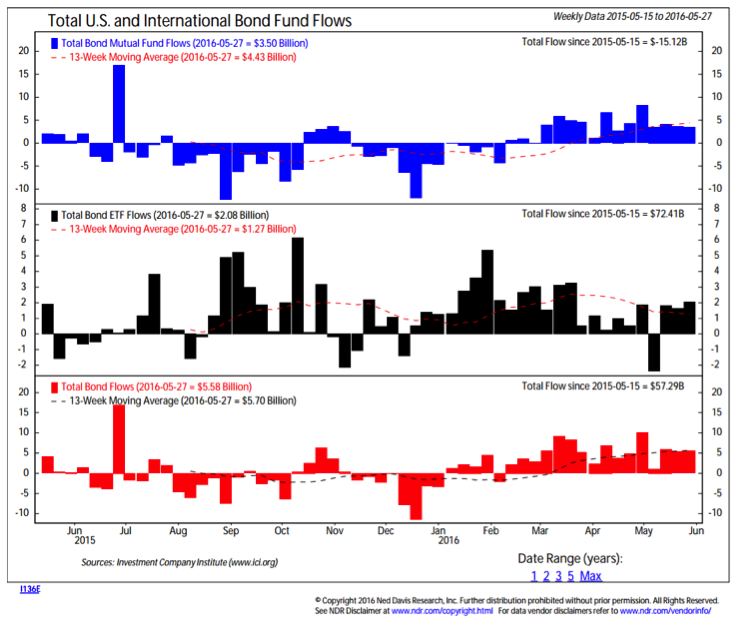
Of some concern is that sentiment indicators now show elevated optimism for bonds. It may not take much of an upward surprise in inflation or even increased rate-hiking rhetoric from the Federal Reserve to push bond yields higher and stem the flow of funds into bonds. This could put downward pressure on the crowded defensive/low volatility trades as well.
Thanks for reading.
Twitter: @WillieDelwiche
Any opinions expressed herein are solely those of the author, and do not in any way represent the views or opinions of any other person or entity.


