It’s mid-August and it’s worth noting that the stock market has historically struggled this time of year.
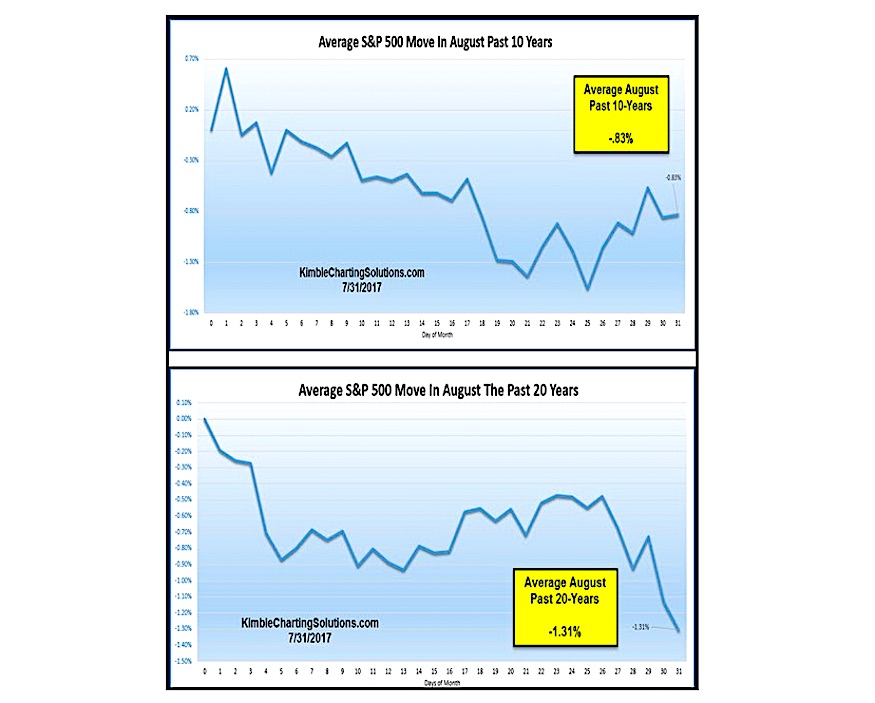
The chart above looks at the average seasonal performance of the S&P 500 Index (INDEXSP:.INX) during the month of August over the past 10 and 20 years.
Will S&P 500 Seasonal Weakness Offer Bears An Opportunity?
The average decline in August is around one percent, which doesn’t seem scary at first glance. But investors should note that this simply an average, and after the run we’ve seen (without a deeper pullback or correction), it’s worth keeping on the prospet of seasonal weakness on your radar.
As well, several key stock market indices have hit strong resistance… and a few are trading in rising wedge patterns (S&P 500, Russell 2000, and Transports). Active investors will want to monitor this closely.
Thanks for reading.
Twitter: @KimbleCharting
Any opinions expressed herein are solely those of the author, and do not in any way represent the views or opinions of any other person or entity.
 Rolling Over At Key Fibonacci Level?")


