Price is always the most important variable in any investment. Pretty simple, right?
Wrong, and even the best investors make mistakes in this regard. From price, we are able to highlight trends, patterns (reversals!), and indicators.
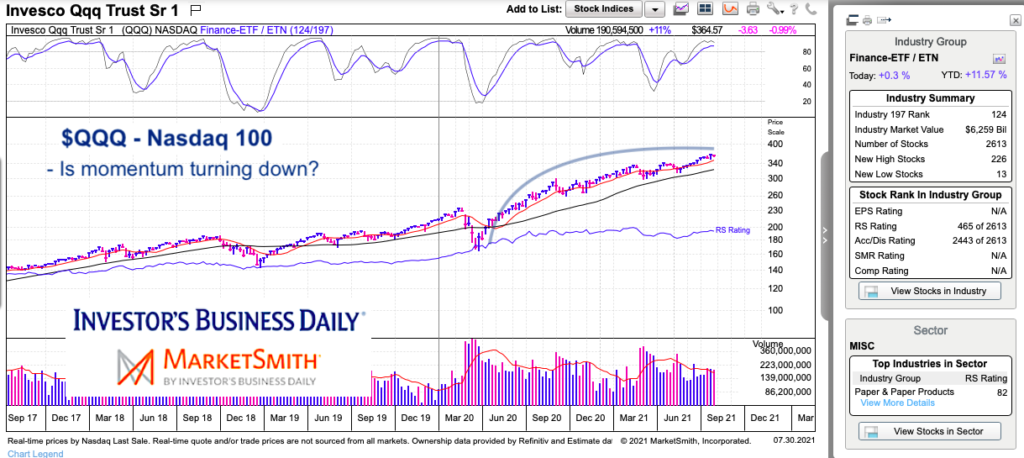
Today, I take a very simple look at the Nasdaq 100 (QQQ) long-term “weekly” chart and discuss what appears to be dwindling momentum. Sometimes the broadest look at a trend can be the best first look (to get the conversation started). This is by no means a complete analysis – it’s just one chart with some high level takeaways. Again, a conversation starter.
Note that the following MarketSmith charts are built with Investors Business Daily’s product suite.
I am an Investors Business Daily (IBD) partner and promote the use of their products. The entire platform offers a good mix of technical and fundamental data and education.
$QQQ Nasdaq 100 ETF “weekly” Chart
A few basic takeaways on why I’m concerned about tech’s performance over the coming 2-3 months.
First, the trajectory of the advance has slowed. YES, QQQ is in an up-trend. YES, tech is still performing in-line. However, as investors we need to be aware of the potential for a reversal. And this has a higher probability when momentum weakens.
Second, momentum indicators are signaling caution (upper pane). Here, we can see that momentum is turning down. Again, price is still holding. But something to be mindful of.
Third, the Accumulation/Distribution ranking is poor (2443/2613 industries). While relative strength is holding, this tells me that all is not well under the surface.
Twitter: @andrewnyquist
The author may have a position in mentioned securities at the time of publication. Any opinions expressed herein are solely those of the author, and do not in any way represent the views or opinions of any other person or entity.

 Rolling Over At Key Fibonacci Level?")


 Rolling Over At Key Fibonacci Level?")

