Key Stock Market Takeaways:
– Recent price improvement in the S&P 500 Index INDEXSP: .INX is encouraging.
– Near-term seasonal patterns are a headwind for stocks, though conditions could improve later this year.
– Copper has been bending but not breaking ahead of a better seasonal backdrop in the fourth quarter.
– If stocks are going to build on this week’s strength and buck seasonal tendencies, look for semiconductors to lead the way higher.
After nearly a month of consolidation, the S&P 500 is breaking out to the upside. The index is trying now to sustain a break through resistance in the 2925-2950 zone.
While the near-term price action is encouraging, momentum remains lackluster overall and breadth is mixed. From a shorter-term perspective, sector-level trends have turned positive (as noted in this week’s Market & Sector Trend Summary).
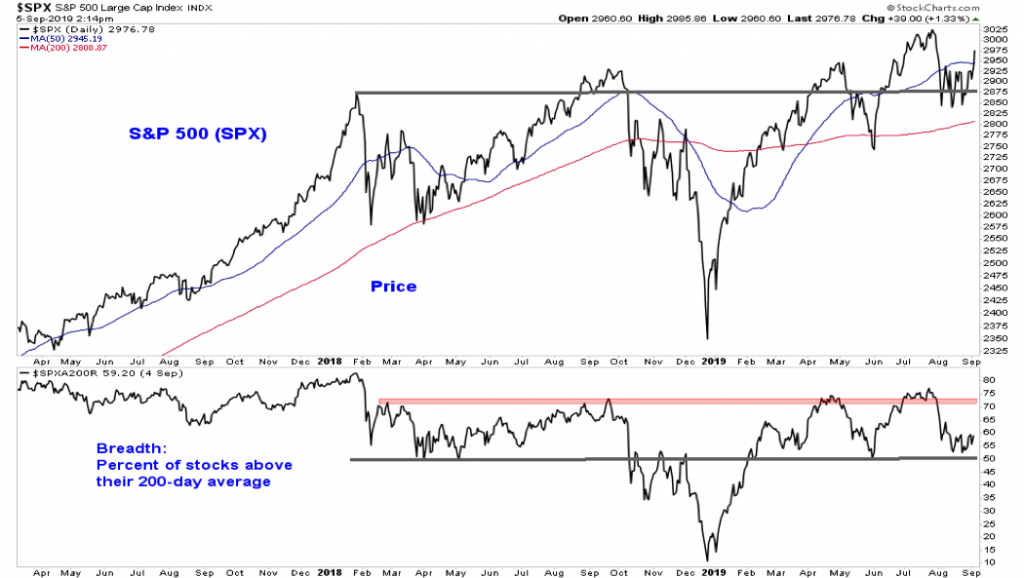
Longer-term breadth trends remain more cautious. The percentage of industry groups in up-trends has slipped and the percentage of stocks trading above their 200-day averages has not (yet at least) confirmed the gains in the index overall.
While the S&P 500 itself is just a few percentage points away from its July peak, the median stock in the index (as of September 4) was more than 10% away from its 52-week high. This mixed technical backdrop comes at a time when seasonal headwinds have not abated. As such, while the recent price improvement is encouraging, we view it with continued caution.
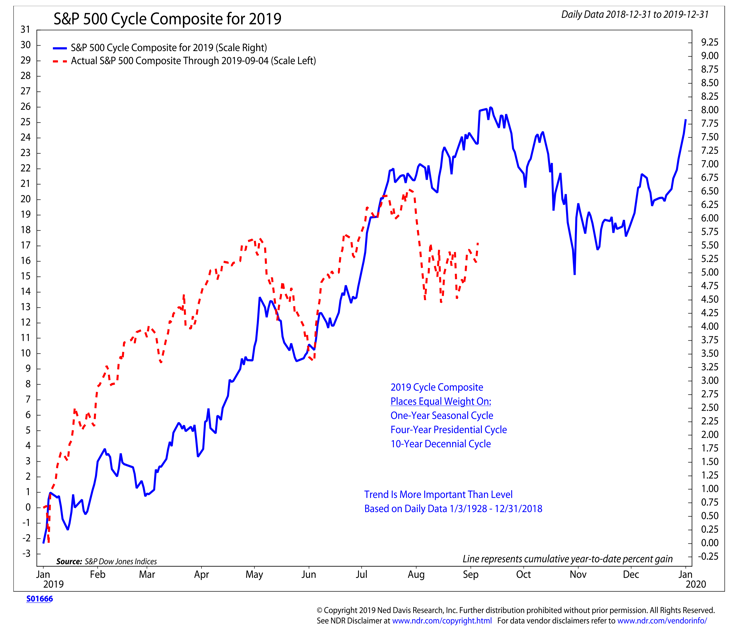
The cycle composite for 2019 (which looks at seasonal patterns from a one-year, four-year and 10-year perspective) suggests stocks are entering the toughest part of the year, with the September-October time frame expected to be weak.
The good news is that this composite suggests a tailwind could emerge as we move through the fourth quarter. We have been hesitant to make much of seasonal patterns since the fourth quarter of last year so notoriously bucked bullish tendencies. Last month’s weakness could be seen as additional evidence that seasonal patterns have lost their usefulness.
When viewed from just the perspective of an annual cycle, however, August’s weakness seems less out of line.
August, however, is one of only two months of the year that have seen negative average monthly returns.
continue reading on the next page…


