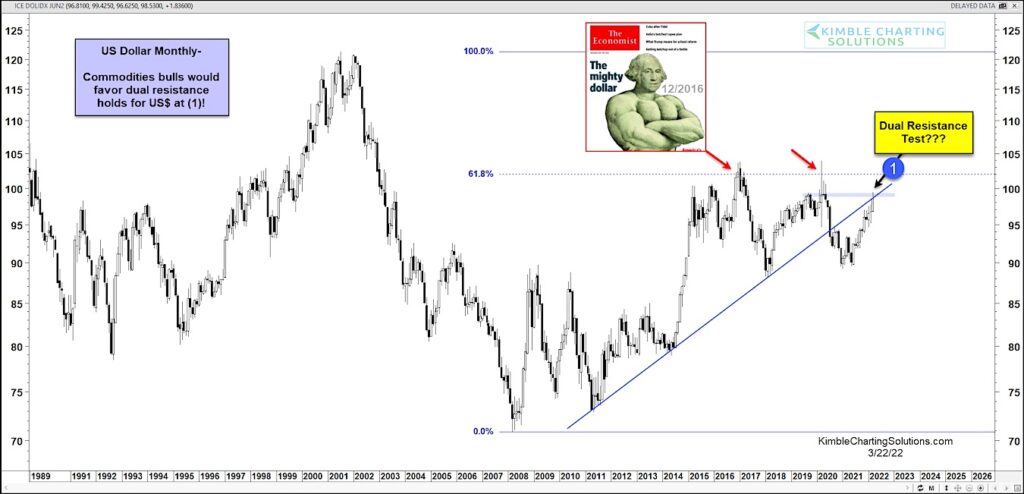
Six years ago, the Economist magazine illustrated the mighty US Dollar. And that marked a peak that has since been tested but not broken out beyond.
The latest rally for the US Dollar has it once again looking strong, but yet again facing important price resistance.
Today’s chart is a “monthly” chart of the Dollar, highlighting this this potentially pivotal moment. As you can see, a convergence of dual resistance has formed at (1). It is forged by a backtest of the previously broken up-trend line and the prior failed breakout test.
Commodities investors are watching the Dollar closely here. Commodities have performed well in spite of the US Dollar strength. We will see what happens at (1) and if the outcome is any different this time. Stay tuned!
Note that KimbleCharting is offering a 2 week Free trial to See It Market readers. Just send me an email to services@kimblechartingsolutions.com for details to get set up.
Twitter: @KimbleCharting
Any opinions expressed herein are solely those of the author, and do not in any way represent the views or opinions of any other person or entity.

")


")
