
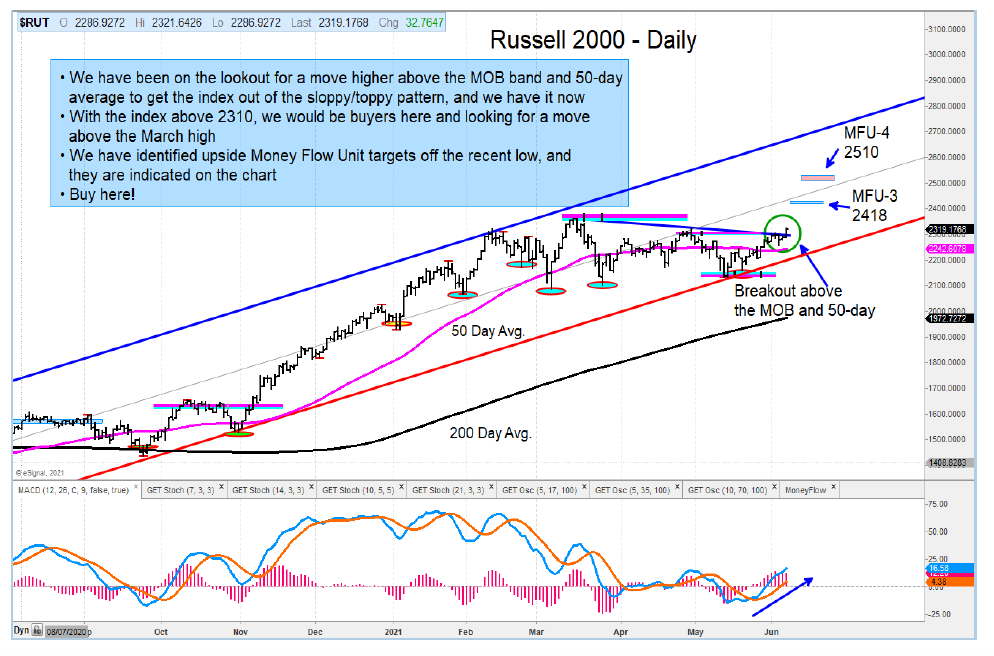
The U.S. stock market has been emboldened by the price action on the Nasdaq 100 Index (NDX) and Russell 2000 Index, as both major indices are breaking out above important resistance zones.
The S&P 500 Index has been at the MFU-3 target area since mid-April and now appears on the verge of also breaking out. A key level I am looking at is for a weekly close above 4225, which I believe will initiate the start of the next leg higher.
Mid-Cap stocks (and the Mid-Cap Index MDY) are holding up well but are not showing the strong momentum of small caps. The long-term uptrend of MDY remains intact.
Relative strength charts are bullish for small cap stocks. The Russell 2000 looks poised to outperform the S&P 500 near-term. I see an upside move of 5% in this spread.
Similar to the Nasdaq 100 (NDX), the Semiconductors (SMH) have broken out. I am still near-term bullish.
Energy stocks, as measured by the Oil and Gas Exploration ETF (XOP), have also been bullish. That said, I do not want to press the bet right here as the ETF is approaching my price target. I will look at pullbacks to add.
Technology is showing signs of accumulation. The XLK ETF looks very similar to the bottom pattern we had in March. I am looking for another move higher.
Both gold and silver remain in their uptrends, and I continue to see higher prices from here.
The author or his firm have a position in mentioned securities at the time of publication. Any opinions expressed herein are solely those of the author, and do not in any way represent the views or opinions of any other person or entity.

 Rolling Over At Key Fibonacci Level?")


