Despite rising political tensions and a more aggressive Federal Reserve Board, equity markets have seen little change over the past week. The S&P 500 (INDEXSP:.INX) and broader stock market have treaded water for the past week.
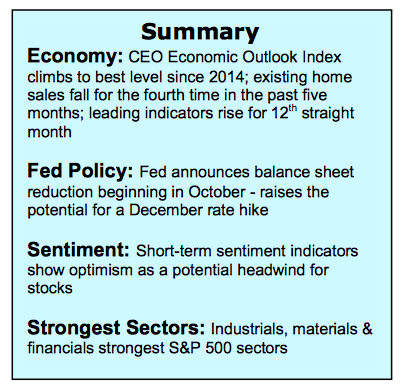
As anticipated the Fed will begin reducing its balance sheet in October by $10 billion a month. More importantly, Federal Reserve Chair Janet Yellen kept a December interest rate hike firmly on the table, which was not widely expected.
The Fed is apparently convinced that the economy is strong enough to absorb a higher rate environment.
This fits with the data offered by the Conference Board’s Leading Economic Index that climbed for the 12th straight month and year-over-year comparisons that point to continued economic expansion. A stronger economy, however, is likely to translate into higher interest rates and a less accommodative policy from the Fed. Additionally, much of the good news on the economy is likely already built into current prices as reflected by the near-record valuations provided to the equity markets.
As a result, the short-term outlook is for stocks to remain in a broad trading range with the best opportunity to break out on the upside occurring later in the fourth quarter when historical seasonal patterns support the prospects for a year-end rally.
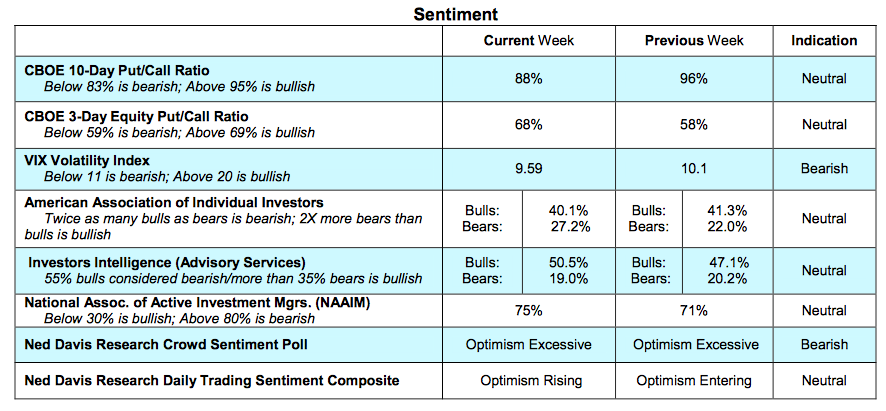
The short-term technical indicators of the stock market are neutral on balance.
Trend indicators are bullish with the Dow recording 42 record highs in 2017. World stock markets also enjoy positive trends with more than 80% trading above their 200- day moving averages.
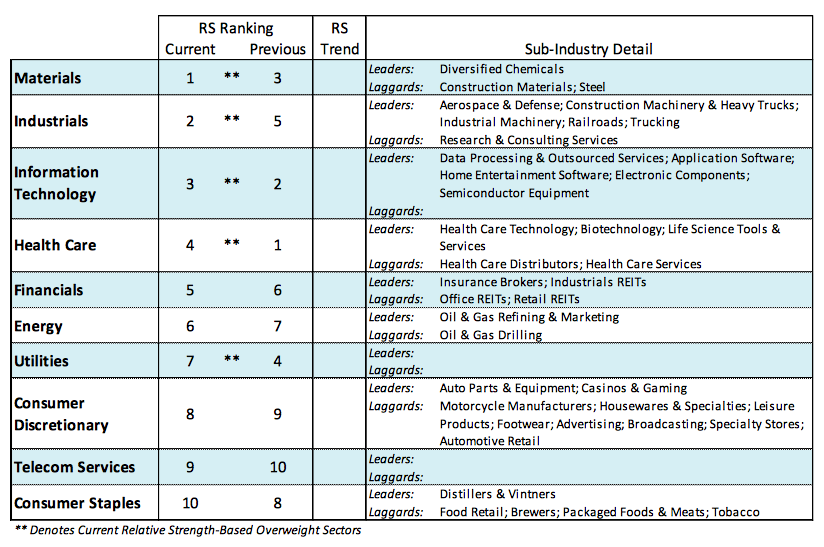
Breadth indicators for the U.S. stock market are improving. After lagging for most of the year, the Dow Transports and Russell 2000 Index are within a fraction of hitting record highs. This would confirm the highs in the S&P 500 and Dow Industrials. The percentage of industry groups within the S&P 500 that are in confirmed uptrends rose to 64% last week from 55% two weeks ago. The broad market would send a bullish signal should the percentage of industry groups climb above 75%.
Sentiment indicators show investor optimism remains elevated and a potential headwind for stocks. Investors Intelligence reports a jump in bulls above 50% (55% is considered excessive and bearish). The National Association of Active Money Managers shows a rise in stock allocations to 75% (80% is considered excessive optimism), and the CBOE data showed a drop in the demand for put options last week dragging the 10-day put/call ratio into a neutral mode from bullish last week. The most impressive rallies this year have occurred with the CBOE 10-day put/call ratio in a bullish mode (above 95%).
Volume historically precedes a change in the direction of stock prices. The fact that the September rally has been accompanied by sharply reduced volume is a potential negative should it persist.
Twitter: @WillieDelwiche
Any opinions expressed herein are solely those of the author, and do not in any way represent the views or opinions of any other person or entity.
")


