Last Thursday marked the end of the first quarter for investors, with the broad market falling during the January to March time period by about 1.2%.
The blame rests on rising interest rates, concern over tariff wars and weakness induced by a user data scandal at Facebook which drove the overall technology sector sharply lower.
The possibility of increased government regulation of the tech industry creates a set-back for the S&P 500 Index as the technology stocks represent nearly 25% of that index. On a positive note, it has become apparent that the tariffs on steel and aluminum and the tariffs of $60 billion on Chinese imports will not deteriorate into a trade war as Canada and Mexico are exempt from the aluminum and steel tax. Additionally the U.S. is China’s largest market.
The news for the U.S. economy remains bullish. The new tax cuts will benefit most Americans and the spending bill just passed should add to economic growth. It is estimated that first-quarter S&P 500 earnings grew by 17.3% which according to FactSet would be the highest earnings growth since the first quarter of 2011.
Additionally, the first-quarter performance in the stock market added to a growing list of technical evidence that the February lows marked the low point for the cycle. Nevertheless, stocks face some uphill hurdles as the Federal Reserve continues its tightening campaign and tech worries continue which may keep the averages locked in a trading range into the second quarter.

Technically, the performance by the equity markets the past two weeks argues that the March 23 low at 2580 on the S&P 500 represents a successful test of the February 8 bottom. The stock market has a long history of retesting the lows following a steep correction. A successful retest is often signaled by positive divergences where some indices hit a lower low but others do not. An example of this can be seen in the performance of the Dow complex on March 23 when the industrials hit a new low but the transports remained above the previous low.
A successful test is also often signified by the decline in the number of issues reaching new 52-week lows. In the present example fewer issues hit new 52-week lows from what occurred at the February bottom. We would be concerned if there was an expansion in the number of issues hitting new lows because this is a signal that the market is headed lower. We are also encouraged by the apparent change in the mood of investors from complacency found at the early-February bottom to concern and skepticism on the March retest.
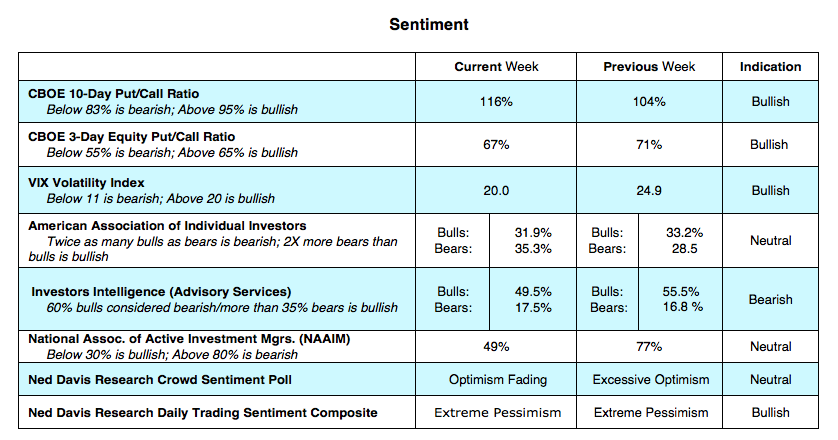
The Bottom Line: Several technical elements exist to suggest stocks are ready to break out of the recent trading range including an oversold condition, positive divergences and lower highs by the VIX Index. What is missing is a significant increase in upside volume. This would require at least one session where upside volume exceeds downside volume by a ratio of 9-to-1 or more. Absent of a surge in upside volume, the markets are likely to remain locked in a wide-swinging trading range of 2570 to 2770 using the S&P 500.
Twitter: @WillieDelwiche
Any opinions expressed herein are solely those of the author, and do not in any way represent the views or opinions of any other person or entity.


")


