Key Takeaways On U.S. Equities Market:
– Stock market breadth is heading in a positive direction but remains neutral in our weight of the evidence framework.
– Another breadth thrust has emerged in the US and Europe is improving.
– Short-term sector-level trends are strong and longer-term industry group-level trends are turning higher.
Rotation in the stock market has negatively impacted recent leaders.
The new high list, which was not robust to begin with, has contracted and just a handful of S&P 500 stocks are closer to their own 52-week highs than is the index to its own peak.
Offsetting this lack of headline leadership, however, has been improving trends among recent laggards. The percentage of S&P 500 stocks trading above their 200-day averages has surged (from an August low near 50% to a recent peak near 77%) and the Value Line Geometric Index (which serves as a proxy for the performance of the median stock) has bounced off its lows.
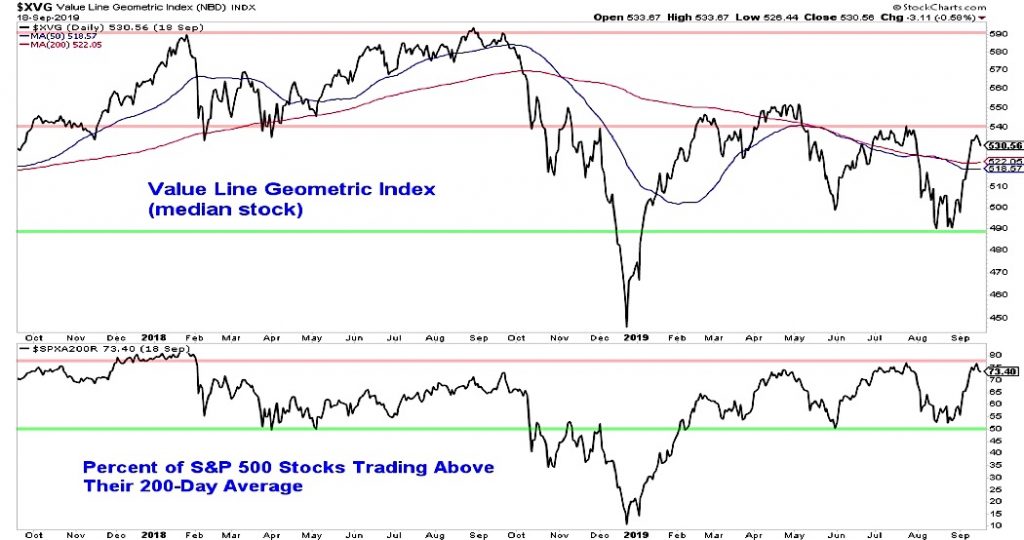
While these improvements are encouraging, they have thus far stopped shy of sending a bullish message for breadth. In terms of the Value Line index, a failure to break above 540 would leave intact the pattern of lower highs and lower lows (by definition, a downtrend). Likewise, a new high in the percentage of stocks above their 200-day averages would confirm the broad market improvement (even if the new high list remains subdued).
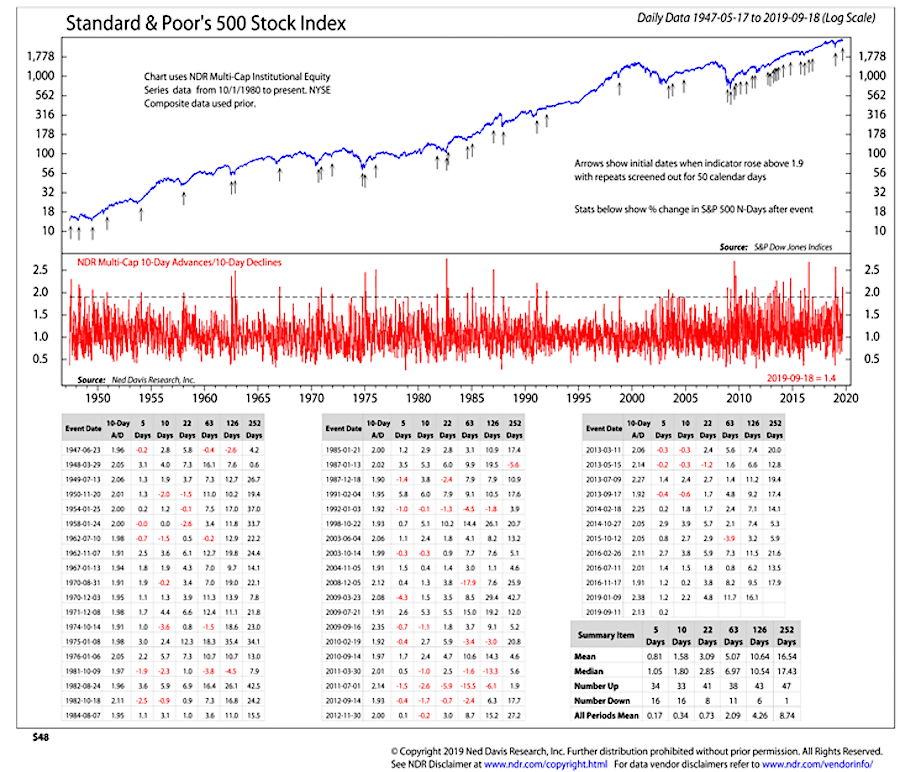
One bullish development that has already accompanied the September market leadership rotation has been the emergence of another breadth thrust (based on the ratio between the advancing stocks and declining stocks, on a 10-day basis). While the number of breadth thrusts has increase in the past decade, their track record suggests they are useful signals of underlying market strength. After breadth thrusts earlier this year argued that the Q4 2018 weakness had run its course, another round of breadth thrusts could signal that a new cyclical leg higher is emerging.
While US-based breadth thrust indicators have turned bullish, the global outlook has been more mixed. In January, an indicator based on the percentage of European stocks above their 50-day averages just missed sending a bullish signal for the first time since 2017.
Conditions in Europe are improving again, however, and 76% of stocks there are now above their 50-day averages (90% is the threshold for a breadth thrust). A similar statistic for the US shows just 71% of stocks above their 50-day averages. Overseas leadership has been absent in recent years, but that could be starting to change.
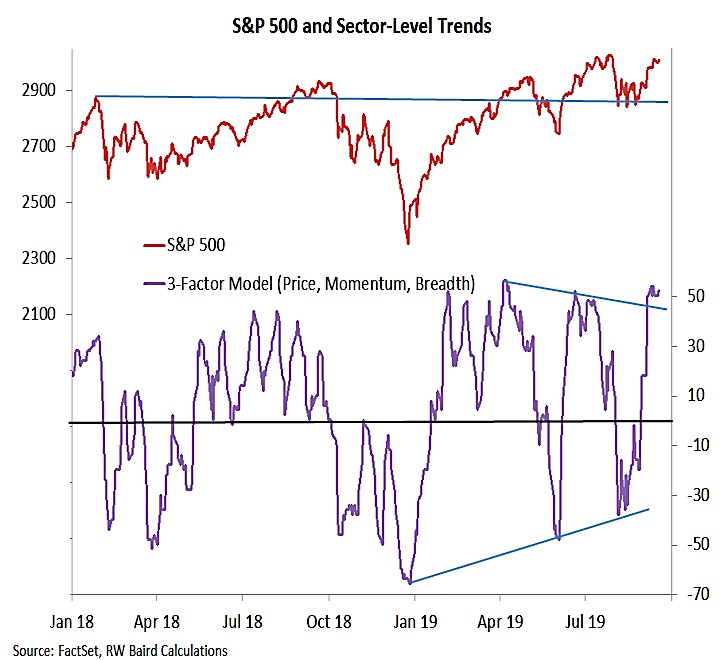
Our sector-level trend indicator measures short-term price, momentum and breadth trends across the 11 sectors that make up the S&P 500. This indicator crossed into positive territory ahead of the index’s breaking out of its August trading range. Sector-level trends have remained strong and the pattern of lower highs that emerged over the course of this summer has been broken. This indicator is short-term in nature and can move quickly, but as long it remains in positive territory it could be a support for the S&P 500.
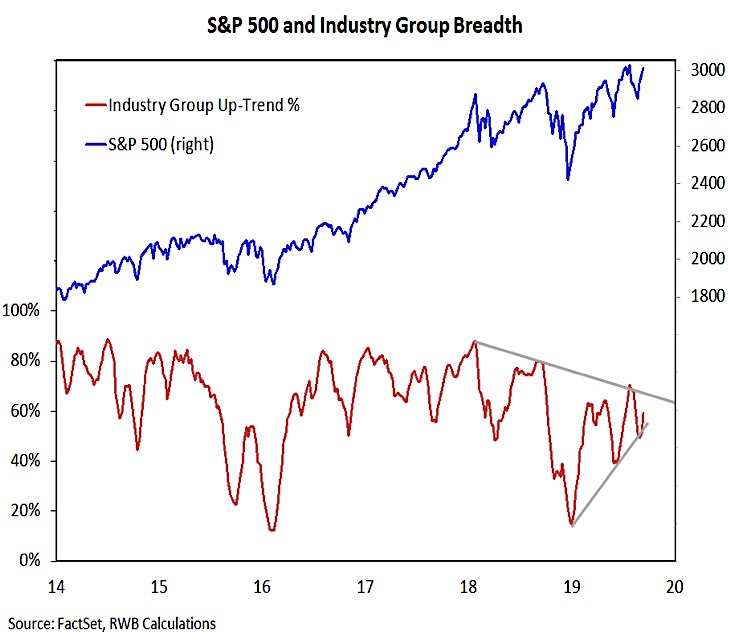
With the S&P 500 again challenging new highs, we are looking for confirmation from our industry group trend indicator. This indicator has made a series of lower highs since January 2018. After bottoming in December, this indicator has also made a series of higher lows (most recently in August). The key now is to see the percentage of industry groups in up-trends climb above 70%. That would eclipse the July peak and confirm the broad market up-trend that has been struggling to emerge over the course of 2019. It would reinforce the message from the breadth thrust indicators and could provide a strong foundation heading into 2020.
Twitter: @WillieDelwiche
Any opinions expressed herein are solely those of the author, and do not in any way represent the views or opinions of any other person or entity.


