Lots of indecision around the Dollar right now. I’m honestly in the “I don’t know” camp when it comes to the current major trend in the US Dollar Index (CURRENCY:USD).
For instance, did the dollar just finish a multi-year A B C upward correction and is it now headed for demise? Or did that move carve out an 3 waves of a rising primary trend (5 waves) and the recent pullback is a 4?
All good questions and today I want to confuse you even more. Ha! Actually, I thought it would be good to look at the charts and highlight some price areas that likely bear importance as we wait and see.
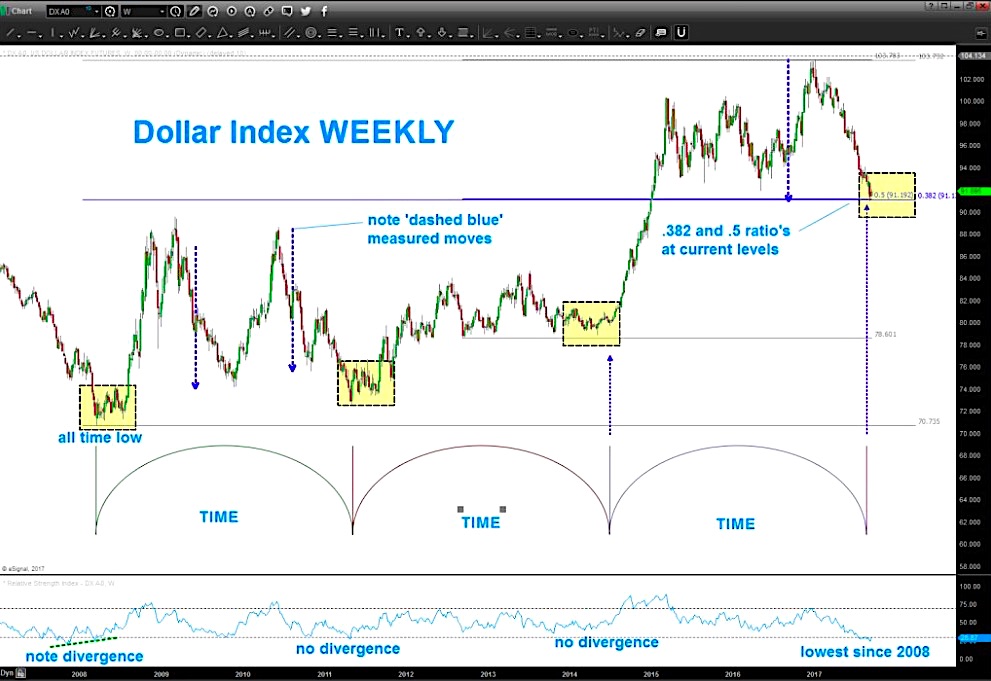
Here are some quick takeaways from the US Dollar “weekly” chart shown below:
- The US Dollar is deeply oversold.
- Hitting confluence of Fibonacci retracements (including the .382 Fib from the all time low).
- You can see a basic time cycle playing out… points to a “turn” happening here.
- RSI is at its lowest level since the all time low in 2008.
- You can see that past measured moves – the dashed blue arrows – align with current move lower.
With this in mind, I believe it’s time to look for a US Dollar turn higher. That said, it’s worth noting that in all of the highlighted boxes it took weeks for the U.S. Dollar Index to consolidate and begin its rally phase. There’s no reason to believe this won’t happen again.
Relief rally or impulsive wave higher? We shall see…
U.S. Dollar Index “Weekly” Chart
Thanks for reading.
Twitter: @BartsCharts
The author does not have a position in mentioned securities at the time of publication. Any opinions expressed herein are solely those of the author, and do not in any way represent the views or opinions of any other person or entity.


