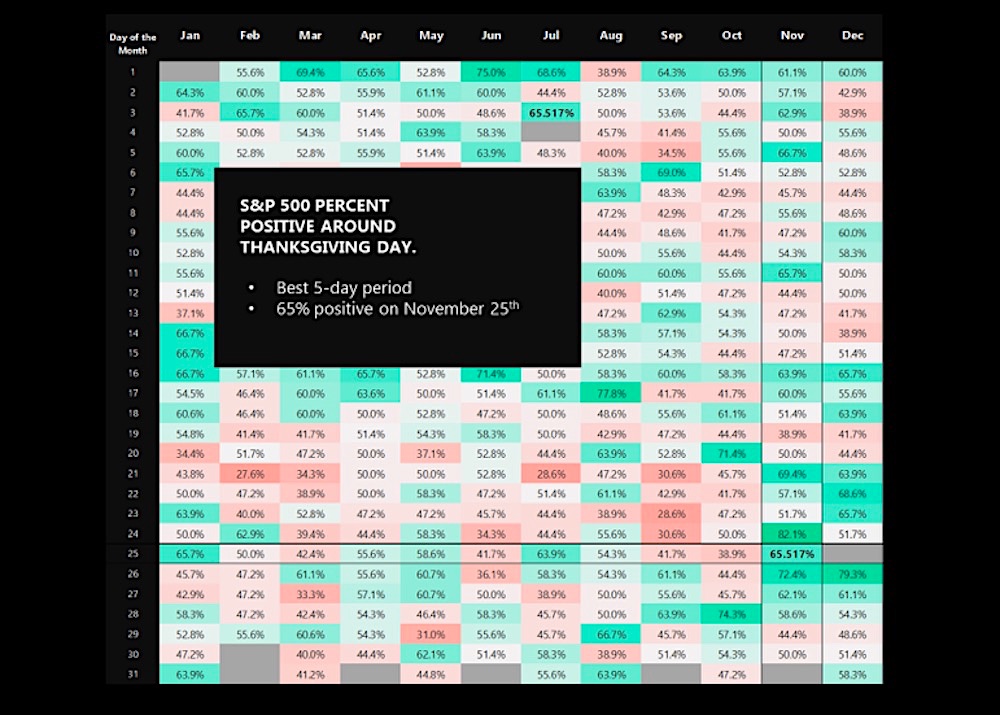
The table below highlights 50 years of trading days for the S&P 500 Index and the percent of the time that each day of the year has been positive.
Instead of looking at a single date, I analyzed all of the historical days in which Thanksgiving has landed on.
In this historical study, I found that over the last 50 years, Thanksgiving has landed between the 7 days of November 22nd, and November 28th.
Now let’s be thankful that these 7 days are up on average 64.4%. That makes these 7 days the best 7 trading days of the year.
The author has a position in mentioned securities at the time of publication. Any opinions expressed herein are solely those of the author, and do not in any way represent the views or opinions of any other person or entity.


 Ready To Break Out?")
")


