These past weeks we’ve talked about the stock market’s hopes of a quick stimulus package.
Tuesday showed how easily the market can flip when stimulus hope fades. It also shows that the market can trade higher on expectations even though it really didn’t know what would happen.
This is a good time to look back on key stock market indicators to see if we should change a bullish bias or if we should wait for more confirmation.
Here we look at the Volatility Index ETF NYSEARCA: VXX and the Junk Bonds ETF NYSEARCA: JNK
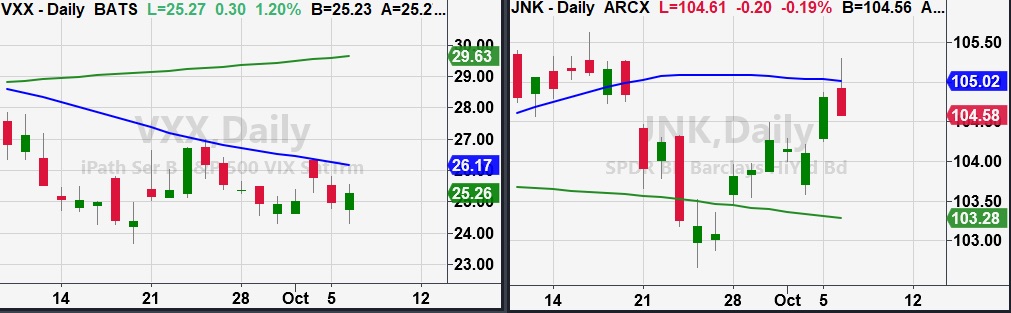
We have recently kept an eye on these two indicators as they speak to broad market strength or weakness.
The Junk Bonds ETF (JNK) shows investors appetite for high yield corporate debt, while the Volatility ETF (VXX) shows short term volatility representing fear in the market.
JNK has been on a steady rally up to the 50-day moving average. Today it broke through, but was not able to hold.
VXX moved up based on Trump’s decision to halt stimulus negations until after the election on November third.
Watching the VXX today will be important to see follow through from fear holding or if it breaks down again.
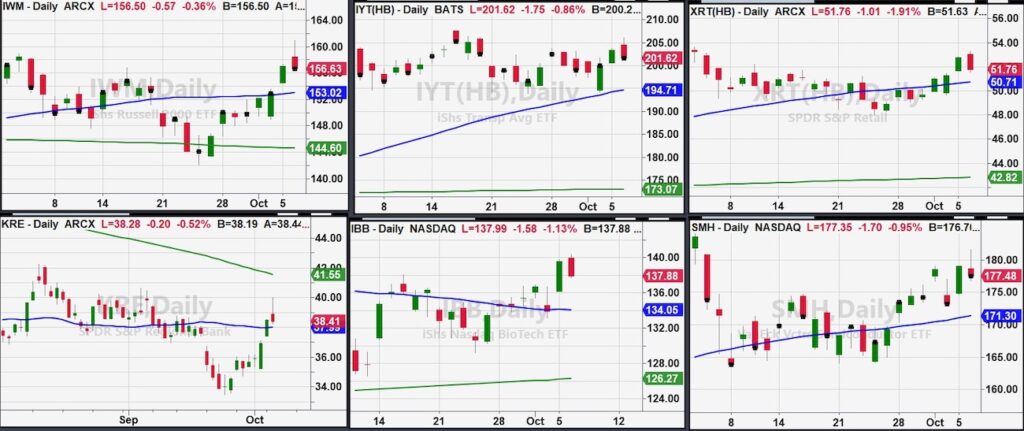
The Modern Family is also good to watch.
On a daily basis the entire family is over 50-day moving average.
If we see continued weakness then watching how those levels hold or don’t will tell us that the market is at risk of breaking down further.
People can change their mind on a dime’s notice, but looking back at the technicals shows that we still have support at these levels and watching for them to break gives us actual data to support changing our expectations.
Boom or Bust-Mish goes head to head with Peter Schiff: https://www.youtube.com/watch?v=HRkF03WcLus&ab_channel=BoomBust
Special Woman In Wealth Opportunity! October 7, 2020 at noon EST – https://www.marketgauge.com/wiw/
Stock Market ETFs Trading Analysis:
S&P 500 (SPY) Closed under the 50-DMA. 332 Support.
Russell 2000 (IWM) 160 Resistance 153 Support
Dow (DIA) 284 Resistance 277 Support. 50-DMA also support
Nasdaq (QQQ) 273 Support. Need to clear back over the 50-DMA
KRE (Regional Banks) Down on the day, but held the 50-DMA
SMH (Semiconductors) 181 resistance. Needs to hold the 50-DMA
IYT (Transportation) 200 support 205 resistance
IBB (Biotechnology) Support 134. 143 Resistance.
XRT (Retail) 56.66 Resistance with support at $50
Twitter: @marketminute
The author may have a position in the mentioned securities at the time of publication. Any opinions expressed herein are solely those of the author, and do not in any way represent the views or opinions of any other person or entity.


 Ready To Break Out?")


