THE BIG PICTURE
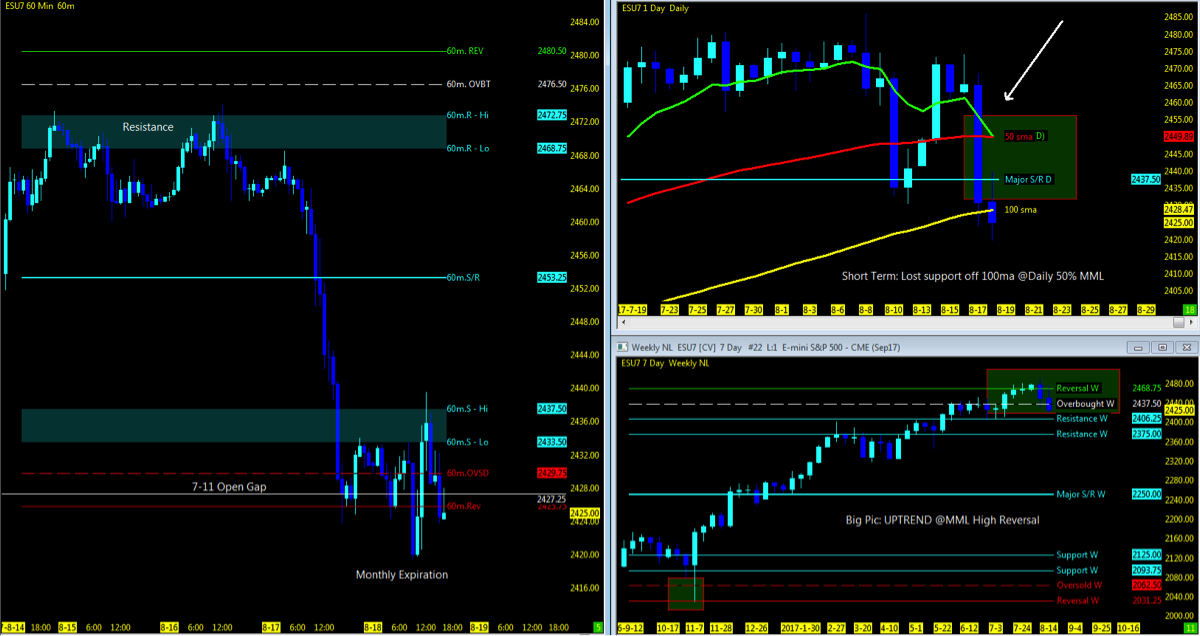
Murray Math Level (MML) Charts
Using the Murray Math Level (MML) charts on higher time frames can be a useful market internal tool as price action moves among fractal levels from hourly to weekly charts. Confluence of levels may be levels of support/resistance or opportunities for a breakout move. Optimal setups will pass through Resistance or Support prior to moving in the opposite trend.
Technical Trends Review
- The Volatility Index (INDEXCBOE:VIX) is holding around 14.
- FANG/FAMMG stocks all off their 52 week high with Starbucks (SBUX) near its 52 week low
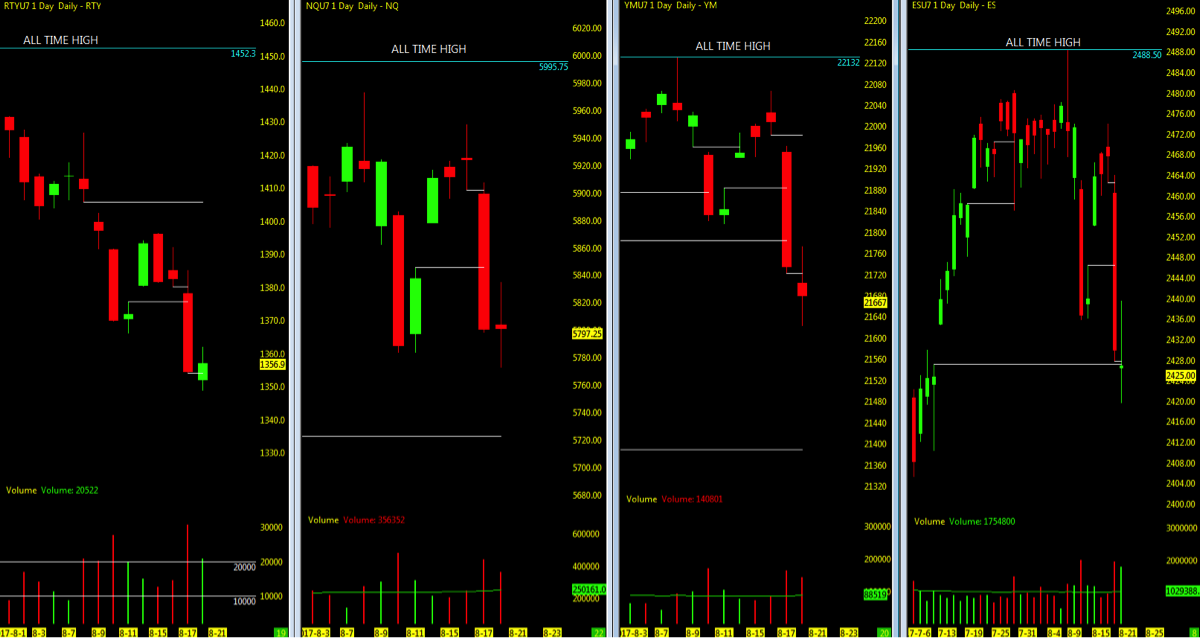
- The stock market indices all under 10 ema and at the hourly MML lows.
- The Dow Industrials (INDEXDJX:.DJI) is the only index at the 50ma; the others are under
- The Nasdaq and Dow with nearest open gaps on downside
- Russell 2000 small caps are leading momentum to the downside
- Crude Oil trend is range bound between 50/200 period moving averages
- Daily Gold off 7/11 MML lows back upside to MML highs into 7 day consolidation
- Transports (IYT) continues to slip with Energy (XLE)
- Technology Sector (XLK) holding strong upside above all key moving averages.
- US Dollar continues to hold near the 2015 lows; Emerging Markets @ 2016 highs
- S&P 500 ETF (NYSEARCA:SPY) up 11.42% YTD
- Total Stock Market Index (VTI) drops under daily 50 ema in uptrend momentum
- Current IBD Outlook: Uptrend under pressure
Key events in the market this week: Fed Chair Yellen.
THE BOTTOM LINE: Technical Momentum probability remains in an UPTREND with confirmed pullback.
To confirm a downtrend on the bigger picture (daily to weekly), watching for not only price momentum to lose support off the 10 and 50, the crossing over the 50 and 144ema would confirm a high probability of further selling downside which has yet to occur. Watching for the 200ma support at this point with the lower MML levels, markets may find some reprieve and bounce up. Watching for price action to close under 2375 on the ES, would surely test and close out the three open gaps below that to 2279 as 2250 to 2125 become the lower targets. Until that time of the crossover, the momentum remains in nothing more than a cyclical and much need pullback correction in the market.
Watch for Yellen’s speech on Friday and end of the summer trading as the unknown of what lies ahead looms over the market. Not completely ready to sell off but the probability that we can regain the highs at any moment which will need to get back above the 50 and 10 period moving averages. Market indices most definitely at a key decision point at MML lows. Does the RTY/TF continue to drive us further down and lead the other indices or do we consolidate here before the next move in the market?
Swing ETF positions should be careful about chasing at the highs as pullbacks/quartley 3sig re-balance are always opportune times to re-enter the trend. All 4 indices have pulled back and stops may be moved to swing low positions if still in for the long trend. No re-entries at this time.
I will notify through social media and my daily outlook; posted 30 minutes prior to the US open of any updates throughout the week.
LOWEST OPEN GAPS
- ES: 1589
- NQ: 3864.75
- YM: 14745
Attempting to determine which way a market will go on any given day is merely a guess in which some will get it right and some will get it wrong. Being prepared in either direction intraday for the strongest probable trend is by plotting your longer term charts and utilizing an indicator of choice on the lower time frame to identify the setup and remaining in the trade that much longer. Any chart posted here is merely a snapshot of current technical momentum and not indicative of where price may lead forward.
Thanks for reading and remember to always use a stop at/around key technical trend levels.
Twitter: @TradingFibz
The author trades futures intraday and may have a position in the mentioned securities at the time of publication. Any opinions expressed herein are solely those of the author, and do not in any way represent the views or opinions of any other person or entity.
 Rolling Over At Key Fibonacci Level?")


