I have often found that for me and my process, systematic trading models are more of an input than an output. That is, I’m not a fan of completely outsourcing investment decisions to a model-based approach.
However, I do see the value of having a systematic model to use as the foundation for a discretionary process built on technical analysis.
The obvious question is: how do you create a simple mechanical model to track market movements?
Years ago, I dug into moving averages and quickly determined that exponential moving averages provided a much clearer representation of price trend. But how are exponential moving averages different from simple or “regular” moving averages?
In today’s video, we’ll introduce the concept of exponential moving averages and walk through a Market Trend Model using these averages on the S&P 500 chart. Here are some questions we discuss in the video:
– How are exponential moving averages calculated, and why do they provide a better indication of trend?
– Why do people use simple moving averages so widely, and should I still pay close attention to them?
– What is the Market Trend Model saying about the current market environment, in terms of risk-on vs. risk-off?
For deeper dives into market awareness, investor psychology and routines, check out my YouTube channel!
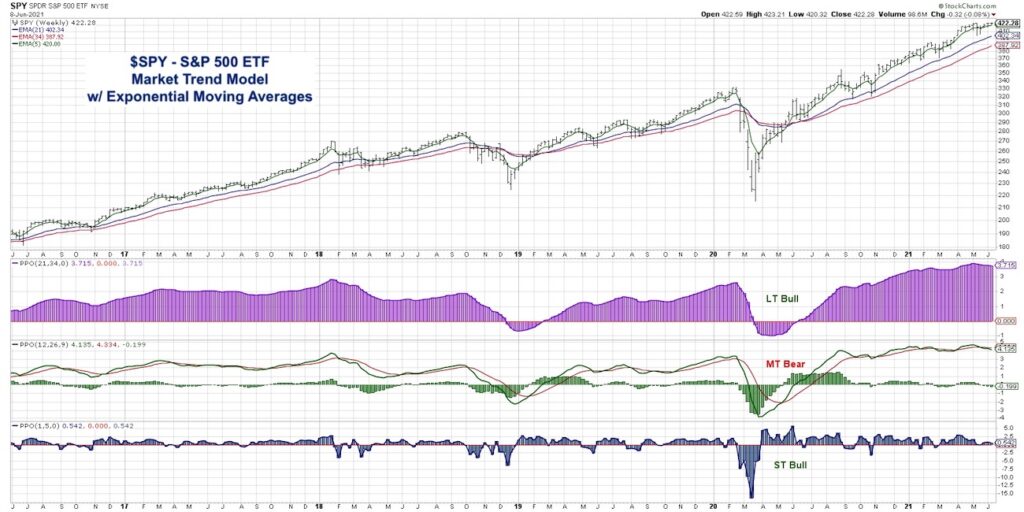
One Chart: Market Trend Model & Moving Averages
S&P 500 Index Exponential Moving Averages Chart
Twitter: @DKellerCMT
The author may have positions in mentioned securities at the time of publication. Any opinions expressed herein are solely those of the author, and do not in any way represent the views or opinions of any other person or entity.

")


