Hanging in there
Our market cycle indicators continue to remain relatively healthy (add an
intonation of some level of surprise).
We continue to expect more indicators to turn bearish in the near term on the economic data side and this should put further pressure on the S&P 500 Index INDEXSP: .INX.
We appear to be in a manufacturing/capex recession and this is gradually spilling over to other areas of the economy. How much spillover there is will of course be crucial for the path of this economic cycle. Still, we now have 20 positive indicators out of a possible 33, which is fairly healthy.
To put this into perspective, remember that period of economic weakness in late 2015/early 2016 that had oil trade down into the $20s? Well, the market cycle indicators got as low as 14 positive during that period, and that was clearly not the end of the bull cycle.
Since our July report, there have been some changes. The Consumer Model moved from mild bullish to mild bearish. This model tracks the relative performance of the U.S. consumer discretionary sector versus the consumer staples sector. It measures a degree of risk appetite in the market, which has been declining of late.
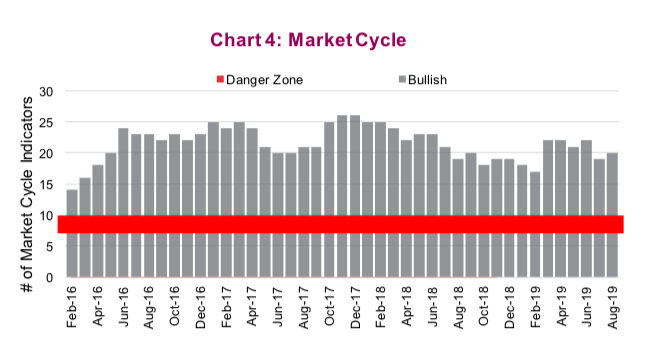
The U.S. economic indicators remained stable in aggregate with leading indicators (three-month change) turning bearish along with chemical activity. Offsetting these were both Consumer Sentiment and Car sales moving from bearish to bullish. The biggest move was likely the Fed Funds, which moved from bearish to bullish given the Fed rate cuts. And given the direction of the economic data and global bond yields, there may be more to come.
Overall, we continue to see enough positive indicators that this market cycle should not be ending in the near term. Of course the data may change and if it does, then we could change our minds.
Elevated correction risk
Even though we are not seeing the economic data fall aggressively and our market cycle indicators are hanging in, we have become more cautious. This included a defensive trade in our asset allocation service at the start of August.
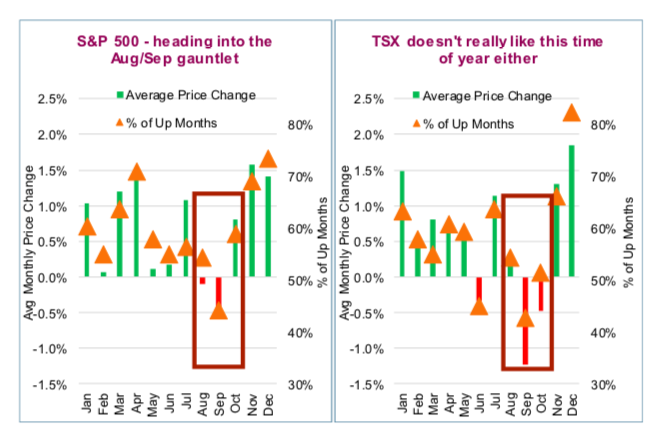
While the trade tussel as a market issue could fade as quickly as it returned, we are seeing a lack of risk appetite that could easily cascade into a correction in the coming weeks. Not helping matters is the fact that we have entered a seasonal time that often sees bouts of short-term market weakness. But it goes a bit deeper than the investors almanac.
Evidence of this risk-off mindset is not hard to find: Gold prices spiking, bond yields falling, safe haven currencies rising, riskier currencies falling, the list goes on. Or just look at ETF flows. In the past two weeks there have been about $11 billion of net selling in equities, $2 billion of buying in commodities (mainly gold) and $3 billion of outflows from bonds. The bond outflows are most interesting as government bond ETFs saw $0.6 billion of buying, aggregate bond ETFs saw $1.4 billion of buying and corporate bond ETFs saw $6 billion of outflows. Risk-off!!!
If the economic data softens more in the coming weeks, we believe the market will throw a little tantrum about a potential recession. And it’s August.
Source: All charts are sourced to Bloomberg L.P. and Richardson GMP.
Twitter: @ConnectedWealth
Any opinions expressed herein are solely those of the authors, and do not in any way represent the views or opinions of any other person or entity.
 Rolling Over At Key Fibonacci Level?")


 Rolling Over At Key Fibonacci Level?")