Broad Stock Market Outlook for Jan 26, 2018
The bullish price action continues for stocks as dips find value buyers. But at these levels traders need to remain focused on their price support levels. Holds are our cue to enter long, while failures at support levels will bring countertrend shorts into lower levels.
Note that you can access today’s economic calendar with a full rundown of releases.
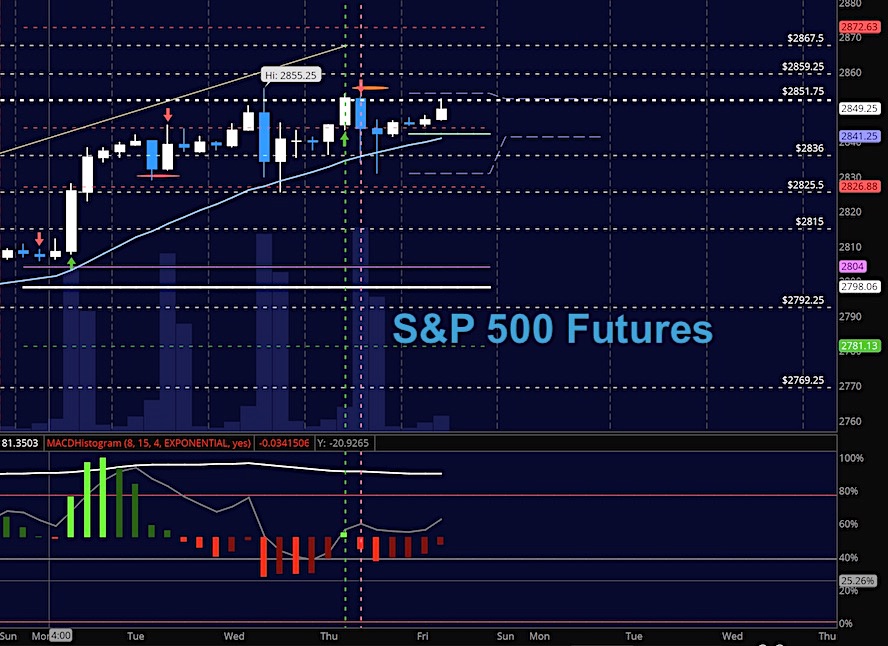
S&P 500 Futures
For possibly the third day, we see that fades can be deep and feel like reversal except for those value buyers who continue to come to the rescue. Mixed momentum and price compression are underlying conditions at this time. Buying the breakouts will stretch our risk thresholds and continue to be ill-advised. The bullets below represent the likely shift of trading momentum at the positive or failed retests at the levels noted.
- Buying pressure intraday will likely strengthen with a positive retest of 2851.75
- Selling pressure intraday will likely strengthen with a failed retest of 2840.75
- Resistance sits near 2850.75 to 2855.75, with 2859.25 and 2872.5 above that.
- Support holds between 2841.25 and 2836.25, with 2829.25 and 2812.75 below that.
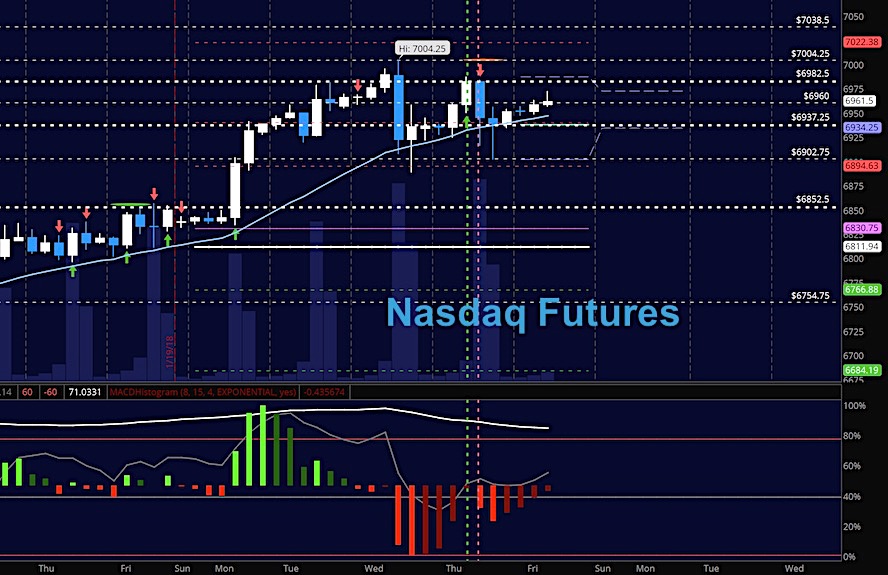
NASDAQ Futures
The NQ_F has failed to recapture the formation of ‘higher low higher high’ since its test above 7000 – Breaching and holding 6980 will be important for buyers to gather steam but below there, sellers have a chance to push us back down. The bullets below represent the likely shift of intraday trading momentum at the positive or failed tests at the levels noted.
- Buying pressure intraday will likely strengthen with a positive retest of 6983.75
- Selling pressure intraday will likely strengthen with a failed retest of 6934.5
- Resistance sits near 6972.25 to 6983.25 with 6997.75 and 7004.5 above that.
- Support holds near 6947.75 and 6924.75, with 6904.25 and 6852.25 below that.
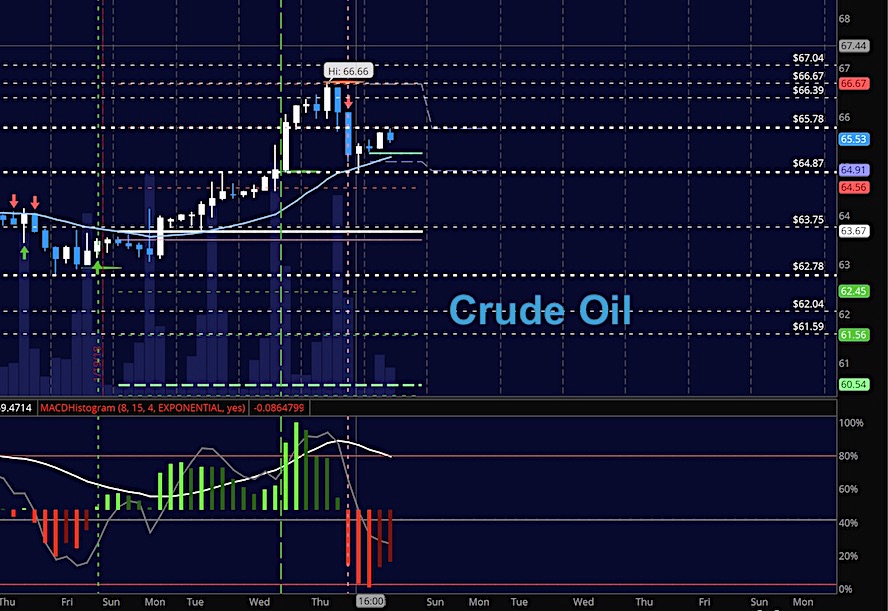
WTI Crude Oil
As mentioned yesterday, the support level to watch was 65.8 which failed and took us into our 64.87 support target noted yesterdfay as well. We are now testing old support as new resistance. Above this 65.8, we’ll see our old highs, but I suspect we shall grind here a while and build some acceptance. Failure to hold 65.4 today will bring lower lows into view. The bullets below represent the likely shift of trading momentum at the positive or failed tests at the levels noted.
- Buying pressure intraday will likely strengthen with a positive retest of 65.85
- Selling pressure intraday will strengthen with a failed retest of 65.4
- Resistance sits near 66.4 to 66.7, with 67.04 and 67.46 above that.
- Support holds near 65.4 to 64.87, with 64.56 and 64.04 below that.
If you’re interested in the live trading room, it is now primarily stock market futures content, though we do track heavily traded stocks and their likely daily trajectories as well – we begin at 9am with a morning report and likely chart movements along with trade setups for the day.
As long as the trader keeps himself aware of support and resistance levels, risk can be very adequately managed to play in either direction as bottom picking remains a behavior pattern that is developing with value buyers and speculative traders.
Twitter: @AnneMarieTrades
The author trades stock market futures every day and may have a position in mentioned securities at the time of publication. Any opinions expressed herein are solely those of the author, and do not in any way represent the views or opinions of any other person or entity.

 Rolling Over At Key Fibonacci Level?")


 Rolling Over At Key Fibonacci Level?")

