Key Stock Market Charts Show Bearish Divergences
Back in 2007, the stock market was partying all the way up to the beginning of the crash.
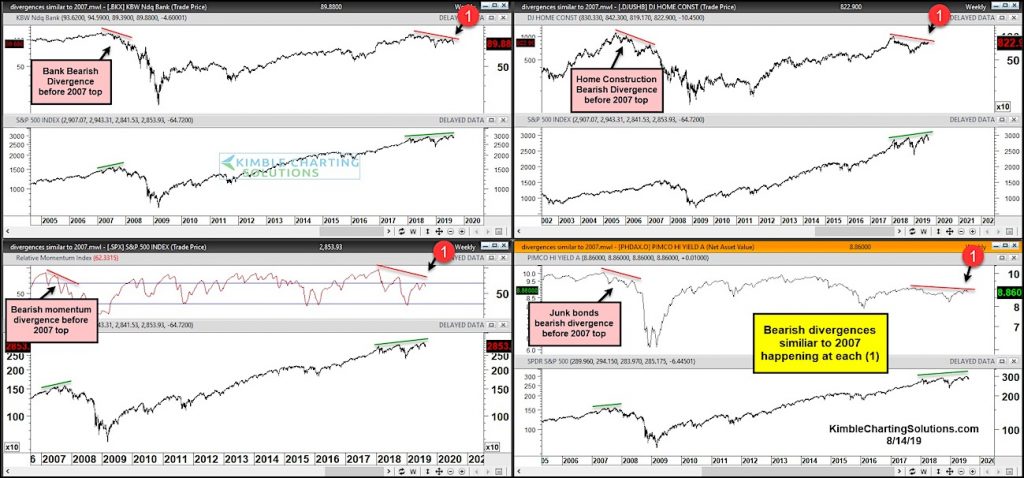
But in the background, some notable bearish divergences were forming on key stock market indexes.
Those indexes are shown in today’s chart – the Bank Index, Homebuilders Index, S&P 500 Index (momentum) and Junk Bonds – and they may be sending a bearish message to investors today.
All of these stock market indexes are important economic indicators, so investors would be wise to follow them.
And, as you can see in the chart, these key economic bellwethers are showing similar bearish divergences to 2007.
Deja vu all over again? If so, we could be in line for a significant decline. Stay tuned!
Note that KimbleCharting is offering a 2 week Free trial to See It Market readers. Just send me an email to services@kimblechartingsolutions.com for details to get set up.
Twitter: @KimbleCharting
Any opinions expressed herein are solely those of the author, and do not in any way represent the views or opinions of any other person or entity.


 Ready To Break Out?")


")
