Bulls 1, Bears 1. Thus reads the scorecard so far this week. Clearly, stock market bulls have work to do if they want to keep the ball in their hands.
Here are some high level takeaways:
- So far this week, both bulls and bears can claim victory
- Watch out if/when VIX breaks out of downward sloping Oct 14 trendline
- Stock market Bulls have the ball and it could prove costly if they fumble; The S&P 500 is at a crucial technical level
One week ago yesterday, the S&P 500 large cap index (2123.48) scored an intra-day all-time high of 2134.72. The index had just broken out of a nearly-three-month range. Things were looking pretty good and Bulls were sitting in the driver’s seat.
One week later and we probably cannot make that same assertion with the same level of conviction as the breakout hasn’t materialized just yet.
S&P 500 Chart
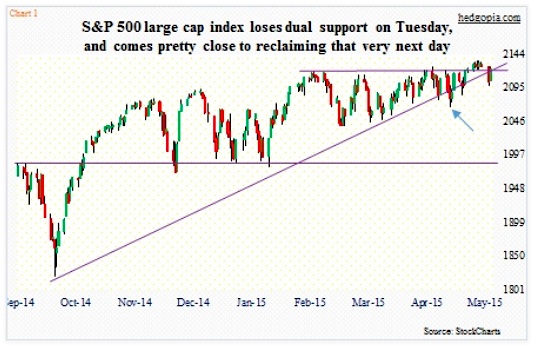
Tuesday gave a big jolt to what otherwise has been a pleasant ride. Bears took over that day, and were able to inflict some damage. Not only was the index pushed down below the breakout point but it also lost the October 2014 trend line. This is not the first time in the last seven months the index has lost that trend line. It happened on May 6 (blue arrow in the chart above), but it was fleeting; two days later the index was back above it.
With the strong action yesterday, the S&P 500 is essentially sitting on the confluence of that dual resistance. One more nice push, and it will be back above it. The breakdown will have been negated. While this remains a possibility, between then and now, some notable differences have occurred elsewhere.
Dow Jones Transportation Average (TRAN) Chart
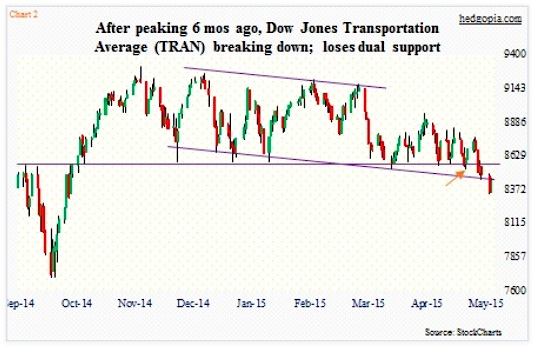
On May 6, the Dow Jones Transportation Average (TRAN) was still above its nine-month horizontal support (orange arrow in chart above). Now, it has lost that. As well, it has broken below the channel it has been in from the start of 2015. Once again, with the one-plus-percent move yesterday the Average now finds itself right underneath the lower end of that channel.
The next few sessions are crucial.
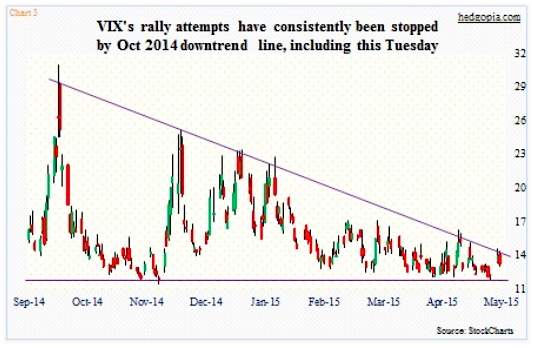
This also applies to the Volatility Index (VIX). In the middle of last October, the S&P 500 came very close to losing 10 percent before reversing. The so-called fear index peaked at an intra-day high of 31.06 then. The S&P 500 has gone on to make one after another new high, even as the VIX has consistently made lower highs (see chart below). On Tuesday, it rallied 20-plus percent intra-day but was stopped right at that downward sloping trendline. The range is getting narrower. A decision time is approaching.
Volatility Index (VIX) Chart
As things stand now, there is enough divergence in the data for both bulls and bears to cherry pick to support their own bias – probably what happens when not everything is moving in sync. Bears, for instance, can point to the lagging transports. Bulls can point to the recent breakout by regional banks, and semis yesterday.
S&P 500 Earnings Chart
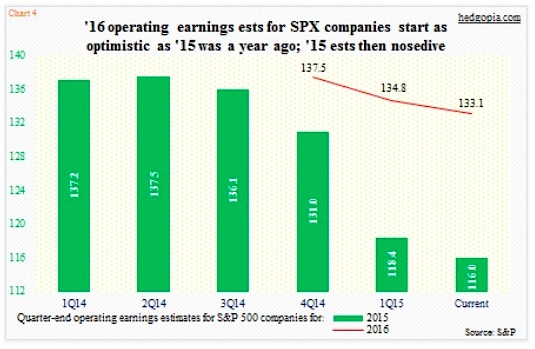
It is natural for bears to point out how 2015 operating earnings estimates for S&P 500 companies have nosedived. The path of downward revision has been ugly. By 2Q ’14, estimates for this year stood at $137. It is $116 now (see chart above). Earnings were $113 last year. On 2015 estimates, the S&P 500 trades at north of 18x. Not cheap. Bulls are no longer focused on 2015, rather 2016. Over the last two quarters, 2016 estimates have come down as well, but nothing comparable to what 2015 has been through. By the way, as early as 4Q ’14, 2015 estimates stood at where 2016 estimates are currently. Makes you wonder what kind of faith we should be putting into these estimates.
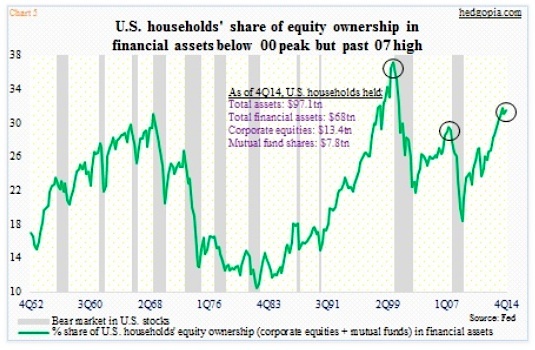
Or take the next chart, for that matter. It shows U.S. households exposure to equities. As a percent of financial assets, it stood at 31.1 percent in 4Q ’14 (1Q ’15 numbers are not out yet). This is higher than the 29.1 percent in 2Q ’07, shortly before things began to come apart, but not as high as the all-time high of 36.8 in 1Q ’00. So for bears, the green line is already flashing yellow/red. For bulls, there is room for it move higher still. In other words, no blow-off top just yet.
US Households Share Of Equity Ownership
This pretty much describes the past couple of days – the duel between bears looking for pullback/correction and stock market bulls looking to push the S&P 500 past 2138 (and towards 2200). Bulls have the ball right now, and they better not fumble. This is too important a spot for bears to intercept.
Thanks for reading!
Read more on Paban’s blog Hedgopia.
Twitter: @hedgopia
No position in any of the mentioned securities at the time of publication. Any opinions expressed herein are solely those of the author, and do not in any way represent the views or opinions of any other person or entity.


