The 50-day moving average did its job!
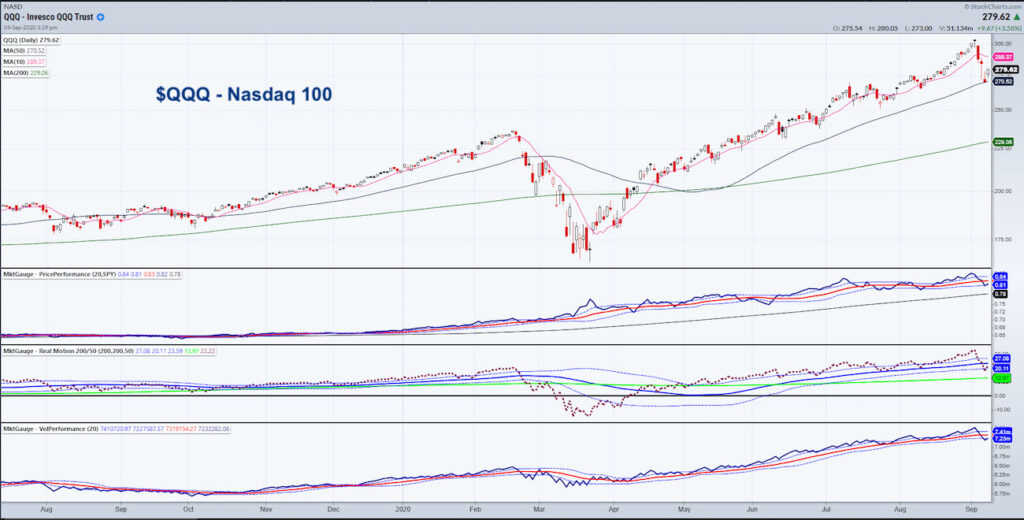
After a perfect touch-down in the NASDAQ 100 ETF (QQQ) to the 50-DMA at 270, the QQQ gained 2.92% today.
All the issues for the tech decline, including Softbank, overbought conditions, lack of a stimulus deal, China tensions, vaccine delays, etc. got stock market bears suited up for riding the waves.
However, just like what we have seen for an exceptionally long time, the stock market ignored everything and put those bears back on dry land.
The high in QQQs on September 2nd was 303.50.
The low was 269.66 on September 8th.
A 50% move takes QQQs to around 281. Today’s high was 280.05.
So bears, I’d keep my life preservers on in case.
Yesterday’s price action put in a near textbook inverted doji hammer candle.
For those of you who do not know candles, an inverted doji typically means forced selling.
When it happens right on a major moving average, you should take notice.
Furthermore, the 10-day moving average in magenta comes in around 289.
The other stock market indicators on the chart are our price performance and real motion indicators.
Price performance shows that the Nasdaq 100 is now underperforming the S&P 500.
Real Motion shows that while the Nasdaq 100 held the 50-day moving average, real motion broke below it. That means that there is a divergence between momentum and price… and that momentum is lagging.
The volume performance also broke below its moving average which indicates a waning performance as well.
Hence, two scenarios are likely now that the Nasdaq 100 (using QQQ) held the 50-day moving average and buying replaced selling.
First, a bear flag forms if QQQs cannot clear 281 let alone 289. In that case the next move under 270-271 should bring the bears back into the water.
Secondly, today’s action is a mini V-shape bottom that held the 50-DMA. In that case, thru 281 you can think higher and get out quick if it fails under 277.
Today I spoke with Jill Malandrino on NASDAQ Trade Talks. Here is the link: https://www.pscp.tv/w/1lDxLyXVEXzKm
Trading Insights on the Major Stock Market ETFs:
S&P 500 (SPY) Turns out an inside day with 342.64 point to clear, 332.88 support
Russell 2000 (IWM) 153 resistance to clear and 150.50 support to hold
Dow (DIA) 284 resistance 275 support then 272.40
Nasdaq (QQQ) 281, 289 resistance 277, 275, 270 support
KRE (Regional Banks) Broke back to unconfirmed bear phase
SMH (Semiconductors) 166.60 the 50-DMA with 172. Area resistance
IYT (Transportation) 194.67 support with 200 pivotal
IBB (Biotechnology) 125-130 range to break
XRT (Retail) 50.00 key support. 52 resistance
Volatility Index (VXX) VIX holding better than VXX-watch VIX at 28.00 and if can clear back over 30.50 trouble
Junk Bonds (JNK) 104.50 support
LQD (iShs iBoxx High yield Bonds) Starting to look vulnerable under 134.56-that would yield caution
GLD (Gold Trust) 180 did hold and now should hold.
Twitter: @marketminute
The author may have a position in the mentioned securities at the time of publication. Any opinions expressed herein are solely those of the author, and do not in any way represent the views or opinions of any other person or entity.


 Rolling Over At Key Fibonacci Level?")
