In this investing research note, we will analyze key stock market indicators, consider the current trend of the S&P 500 Index (INDEXSP:.INX), and discuss emerging themes that we are watching in our investing research.
Here are some summary highlights:
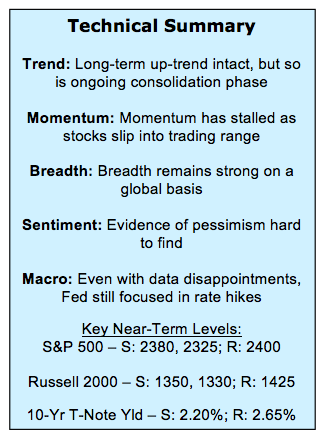
Optimism Re-Emerging But Fund Flows Not Exuberant – After a brief respite, sentiment surveys show that investor optimism is again on the rise. Balancing against this, policy uncertainty (both at home and abroad) remains elevated and fund flows remain well shy of the exuberance seen in the first quarter.
Seasonal Patterns Becoming More Challenging – Despite widespread awareness, the “Sell in May” pattern still seems to hold relevance. On top of that, the cycle composite (which looks at the one, four and ten year cycles) argues for a more challenging environment in the second half of the year.
While the S&P 500 Consolidates, Up-Trends Are Intact Overseas – After a multi-year period of U.S. outperformance, international equities (particularly in Europe and Emerging Markets) have gained relative strength. The S&P 500 remains in a broad trading range and momentum is lackluster, but overseas, the up-trends (on an absolute and relative basis) that emerged last year are intact and momentum is expanding. Tactical investors may want to shift their focus abroad.
Stock Market Indicators
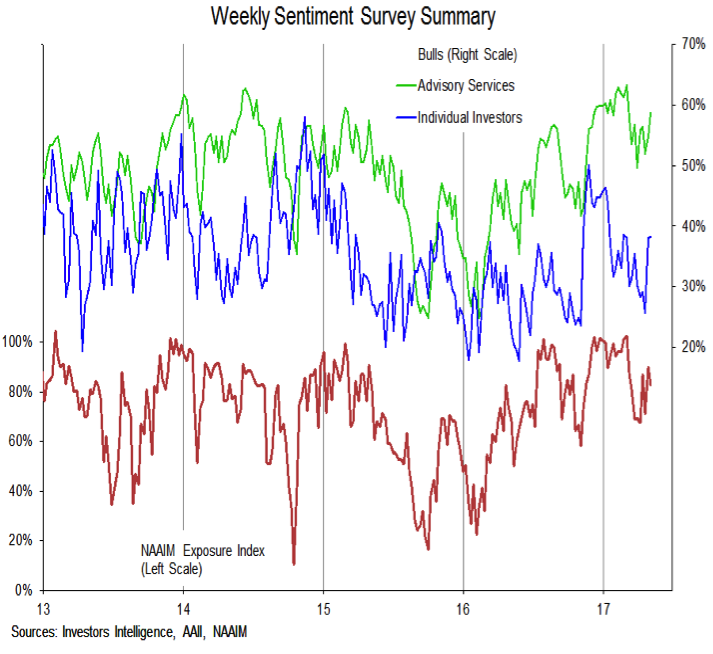
Investor Sentiment
Evidence of extreme optimism could be seen across the sentiment surveys starting in late 2016 and into the first quarter of 2017. After peaking in March, bulls on the Advisory Services survey and the NAAIM Exposure index retreated, echoing the collapse in bullish sentiment among individual investors. Pessimism however, remained conspicuous by its absence. Bears on the Advisory Services surveys remained muted and the drop in optimism appeared to be short-lived. This week shows bears on the NAAIM survey capitulating (even though the overall index dropped slightly) and Advisory Services bulls continued to climb (now at 58%) back toward their March peak.
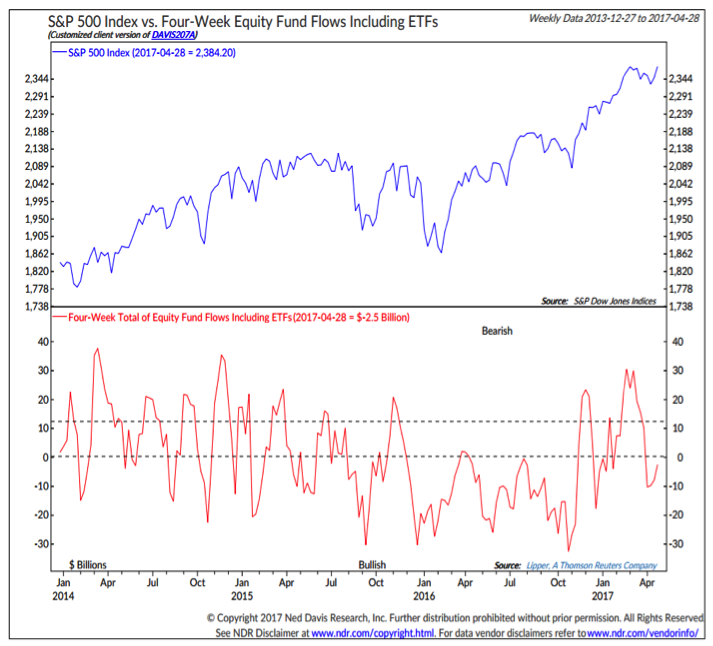
S&P 500 Fund Flows
Separating investor opinions from investor actions can be tricky at times but it makes sense to pay attention to both. Optimism appeared in the surveys over the course of 2016, but equity funds (both mutual funds and ETF’s) showed outflows for much of the year. That changed late in the year and by the first quarter of 2017 inflows to equity funds reached excessive (bearish) levels. Over the course of April, investors returned to shifting assets away from equities. The latest weekly data suggests the pattern may again be changing, but even so, it is not evident that inflows have returned to excessive levels.
S&P 500 – Sell In May And Go Away?
Many popular stock market adages are grounded in at least a kernel of truth and experience. “Sell in May and Go Away” is no different. The bulk of the market’s gains since 1950 have come in the six months from November through April. Often by the time a pattern has reached the point of being an adage, widespread awareness has rendered it unreliable and virtually useless. It is interesting that even as this seasonal switching pattern has gained notoriety, its effect appears undiminished.
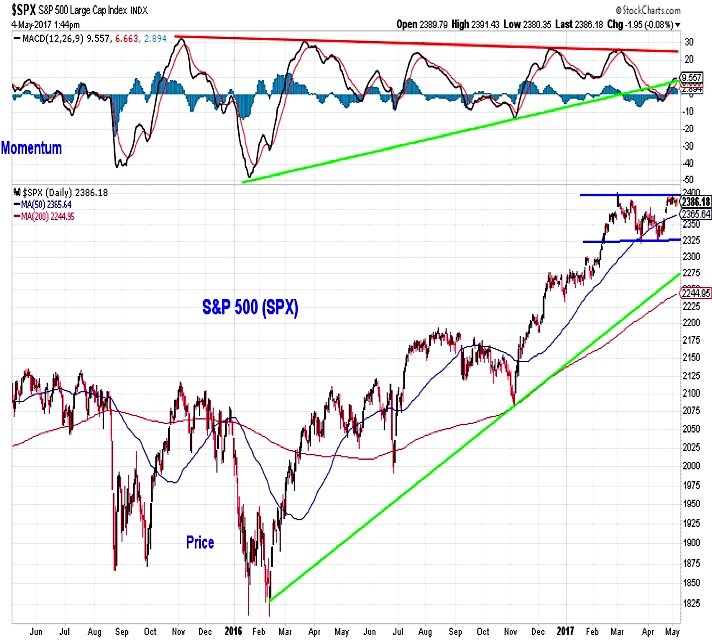
This year, seasonal uncertainty comes at a time when stocks remain in a consolidation phase (although the longer-term rising price trend is intact) with little upside momentum. The late-April rally that produced new highs on the Russell 2000 and the NASDAQ could not generate a meaningful expansion in momentum or carry the S&P 500 above resistance near 2400.
continue reading this post on the next page…

: Showing Some Signs of Emerging Strength")

