Key Takeaways for U.S. Equities:
Stocks are facing their first significant test of 2019 – a test which will reveal the strength of the move off of the late-2018 lows.
Deteriorating momentum and breadth across the S&P 500 and broad market suggest evidence tilts toward looking for pullback rather than consolidation. After moving higher with price, investor optimism could be challenged.
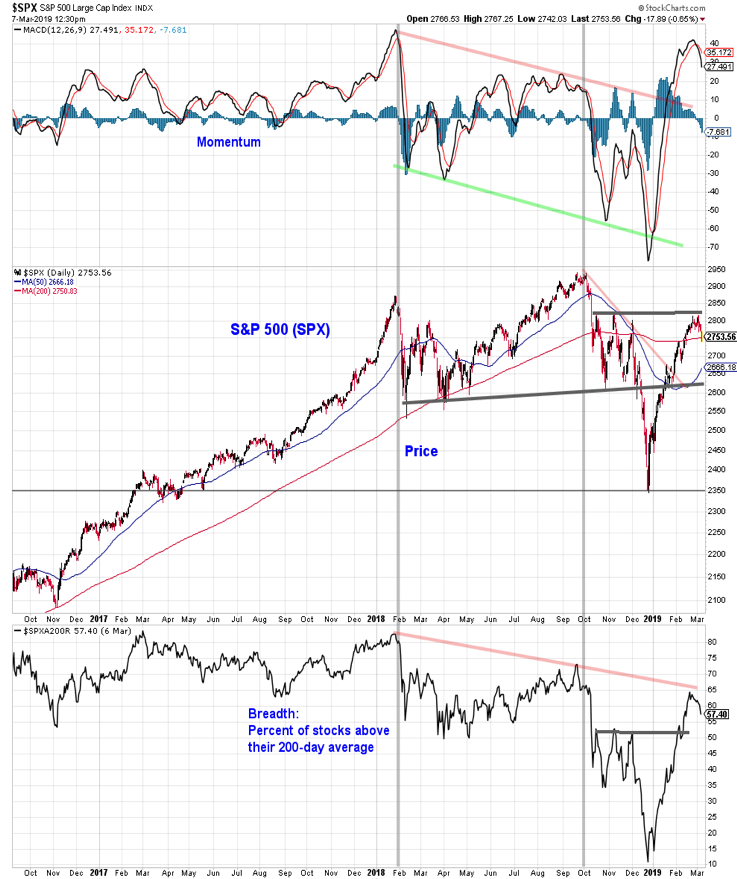
S&P 500 Index
We usually don’t make too much of specific price levels as the message of a chart can be in the eye of the beholder and the importance of a given level is often not apparent until after the fact. That being said, the area just above 2800 on the S&P 500 is interesting as it has rebuffed the bulls four times now.
The most recent failure came this week, as momentum showed evidence of rolling over and breadth pulled back from resistance of its own. Interestingly, while nearly 60% of S&P 500 stocks are above their 200-day averages and 85% are above their 50-day averages, only one-third have 50-day averages that are above their 200-day averages.
If the S&P 500 fails to hold support near where it is currently trading, the 2650-2600 range could soon be challenged. We will look for momentum and breadth trends to stabilize as evidence that the expected pullback has run its course.
Stock Market Breadth
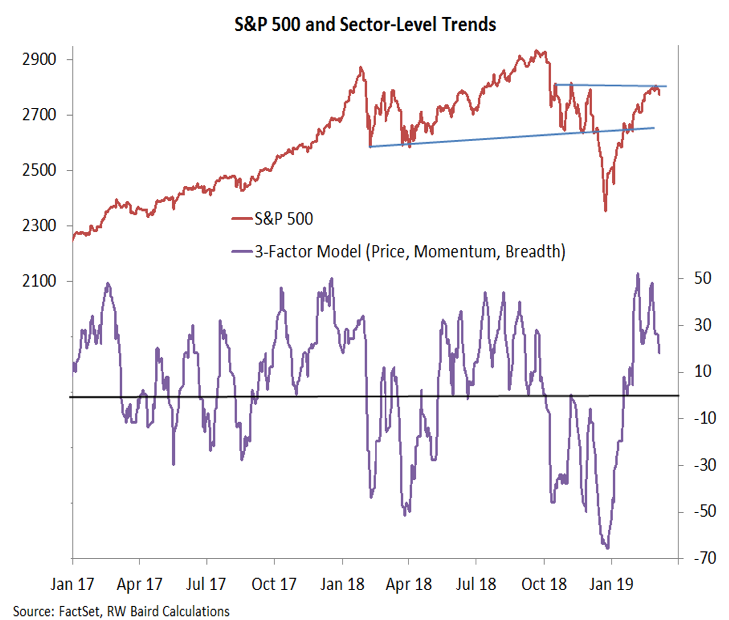
One reason to believe that the next move by the S&P 500 will be more consistent with a pullback than just brief consolidation is the deterioration in sector level-trends. We update this chart (and an accompanying table that details the aggregation that produces this chart) each week in our Market & Sector Rankings Summary.
This indicator has made a lower low after making a lower high, pointing to meaningful weakening in shorter-term sector-level trends. A failure for this to remain in positive territory could suggest that looking for S&P 500 support in the 2650-2600 range may be unduly optimistic.
The breadth thrusts that have garnered so much attention over the first two months of the year suggest a tailwind for stocks over the course of 2019, but do not preclude pullbacks and tests of trend strength.
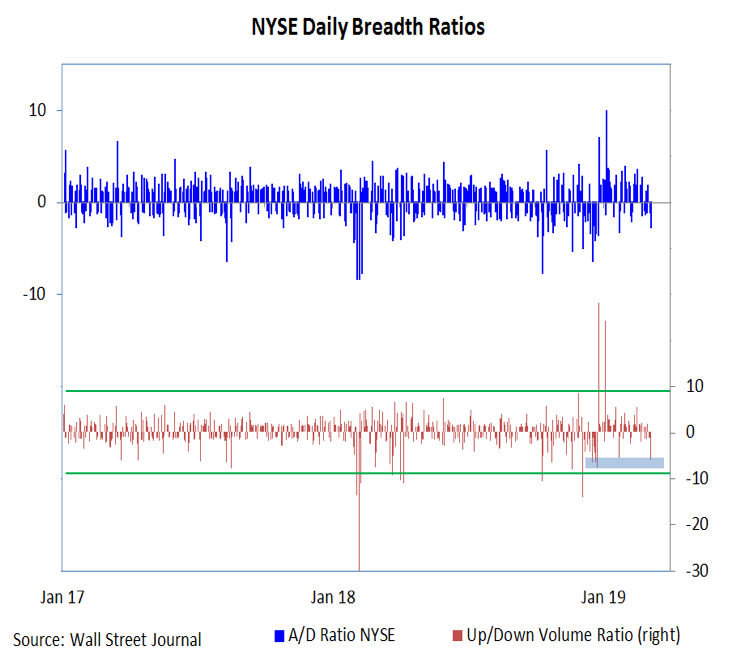
This week provided some evidence that the market internals that provided fuel for the early-2019 rally may be faltering. The daily NYSE up/down volume ratio on Wednesday saw its heaviest tilt to the downside (6-to-1) since December 24. This surge in downside volume did produce a TRIN reading above 2. Such a reading is usually seen as evidence of climactic selling only after a sustained period of weakness (which was not present in the current case).
Wednesday also had the S&P 1500 with over 1300 declining issues, and that too was the most since December 24. While not yet ominous, these internals bear watching as the strength of the 2019 rally is tested.
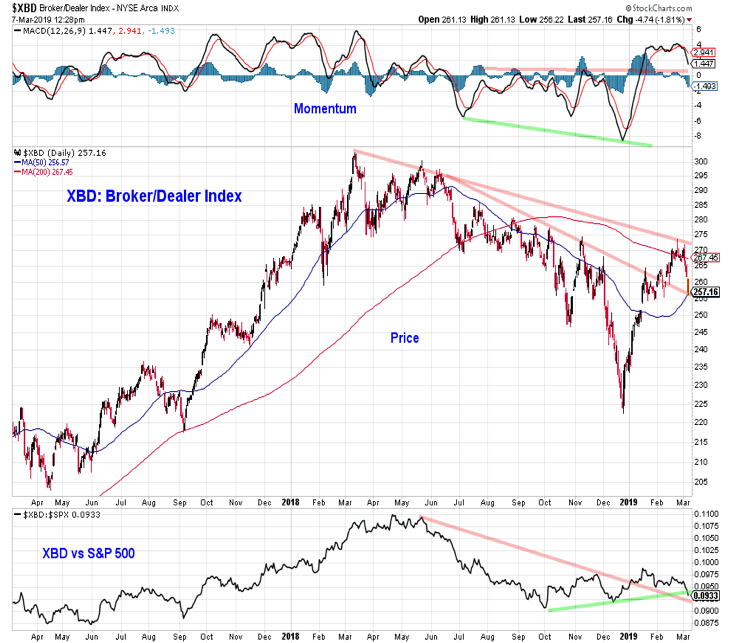
Broker / Dealer Index and Stock Leadership
Leadership in 2019 from the Industrials sector has been encouraging. The performance from the Financials, and the Broker/Dealers specifically, has been less so. The Broker/Dealer Index failed at resistance near the 200-day average, keeping intact the down-trend off of the early-2018 highs. Now the early-2019 breakouts on both an absolute and relative basis are being tested.
Relative to the S&P 500, the Broker/Dealer index made a higher low in December. Since peaking in January, however, the relative price line has been fading and is now approaching important support. Renewed leadership from the Broker/Dealer index could help pave the way for strength in the broader market.
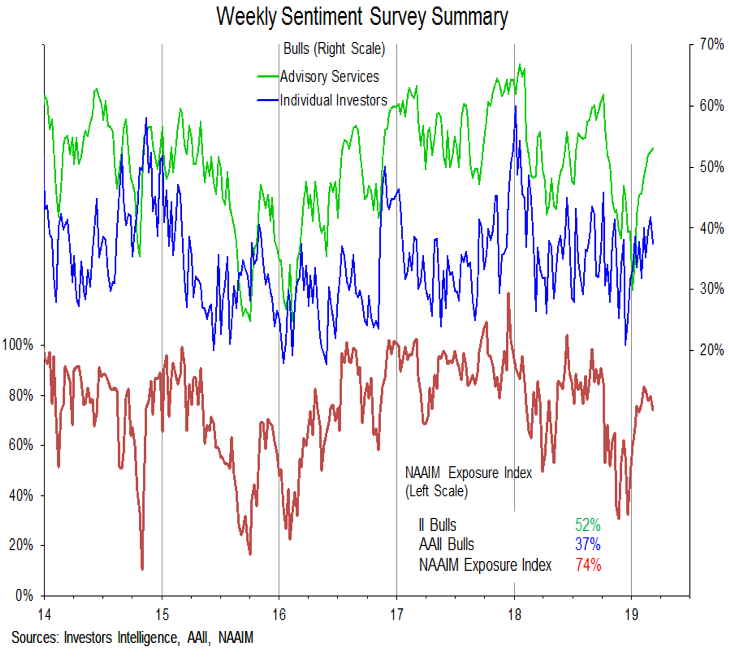
Investor Sentiment
Investor sentiment tends to follow price. As stocks have rallied to begin 2019, bulls on the Investors Intelligence survey moved higher and this week posted their nineth consecutive weekly gain. While optimism generally remains shy of the early-2018 peaks, the hints of fear and concern that briefly emerged at the end of 2018 have largely faded.
While looking for positive breadth divergences to emerge on a pullback in the S&P 500, we are also looking to see how deep-seated optimism has become. It would be encouraging to see sentiment quickly following price lower. A failure to do so could prolong any pullback that is seen.
Twitter: @WillieDelwiche
Any opinions expressed herein are solely those of the author, and do not in any way represent the views or opinions of any other person or entity.


 Ready To Break Out?")

 Ready To Break Out?")
 Rolling Over At Key Fibonacci Level?")
