S&P 500 Trading Outlook (2-3 Days): MILDLY BULLISH
The S&P 500 has covered a lot of ground in the last nine trading hours, recouping nearly 40% of what was lost over the course of nine trading days.
This comes after losing over 10% in just nine days. Clearly, this is much different volatility environment than anything witnessed in 2016-17.
Momentum remains negatively sloped and its unlikely the S&P 500 gets over 2700 near-term without retracing back lower for a retest. As well, market breadth has come in merely near 2/1 positive and not 4/1+. Tuesday could allow for brief rally followed by a reversal lower.
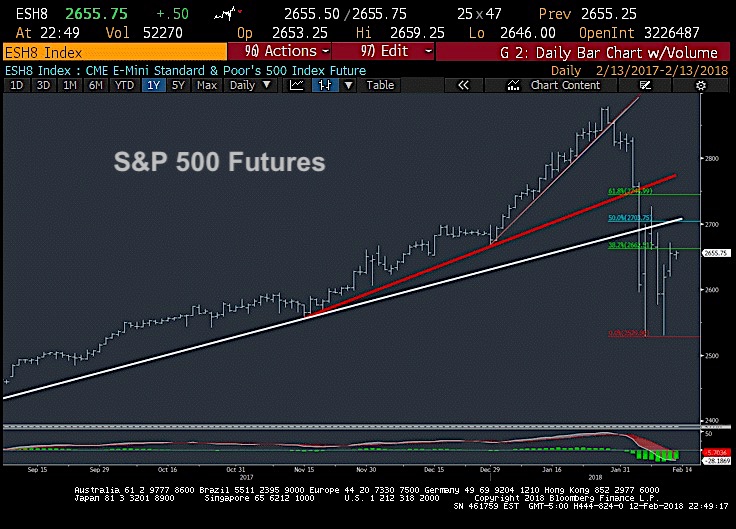
Looking at the chart below, you can see two different trend lines sitting directly overhead, while momentum remains quite negative. Tough to call this a true V-shaped bottom just yet, and still looks right to be defensive and pick your spots to be long, versus expecting an uninterrupted rise back to new highs.
More Technical Thoughts & Market Commentary
Yesterday proved to be yet another sharply positive day, and completed the best consecutive back to back days of gains since 2016. After erasing more than 10% over nine trading days in SPX, we’ve managed to recoup over 35% of this now in just nine trading hours. A particularly difficult time for most to keep up with benchmark stock indices given the need to reduce risk on the violent downturn, while most fail to catch the lows and get back into the market during the upturn.
At current levels, given that momentum remains negatively sloped and SPX has climbed 120 points just since Friday’s lows, it looks like a poor risk/reward to contemplate initiating new buys here, and one might hold off for pullbacks before thinking this decline from late January has run its course. Market breadth came in below 3/1 positive, but 7 of 11 sectors finished with gains above 1%, with Technology and Materials showing particular outperformance. Overall, while 2450-2550 looked to be a good area of downside support, it’s tough to make the case for SPX moving straight back to highs, and some backing and filling is likely over the next 1-2 weeks before a more meaningful bottom can be carved out.
Outside of the S&P 500, Treasury yields continue to climb, while the US Dollar looks close to turning back lower after its recent bounce. This should bode well for emerging market outperformance and a boost in Chinese equities right before the Chinese New Year. Bitcoin also looks to be threatening an upcoming breakout, and above 8900 would start to accelerate higher again, just at a time when most had given up on watching it. Overall, still many moving parts and important to keep a close eye on sector rotation and breadth in the days ahead.
If you have an interest in seeing timely intra-day market updates on my private twitter feed, please follow @NewtonAdvisors. Also, feel free to send me an email at info@newtonadvisor.com regarding how my Technical work can add alpha to your portfolio management process.
Twitter: @MarkNewtonCMT
Author has positions in mentioned securities at the time of publication. Any opinions expressed herein are solely those of the author, and do not in any way represent the views or opinions of any other person or entity.


")


