The S&P 500 should continue its rally into this week, targeting the 200 day moving average.
That seems to be a magnet any time price gets to within 2-3 percent…
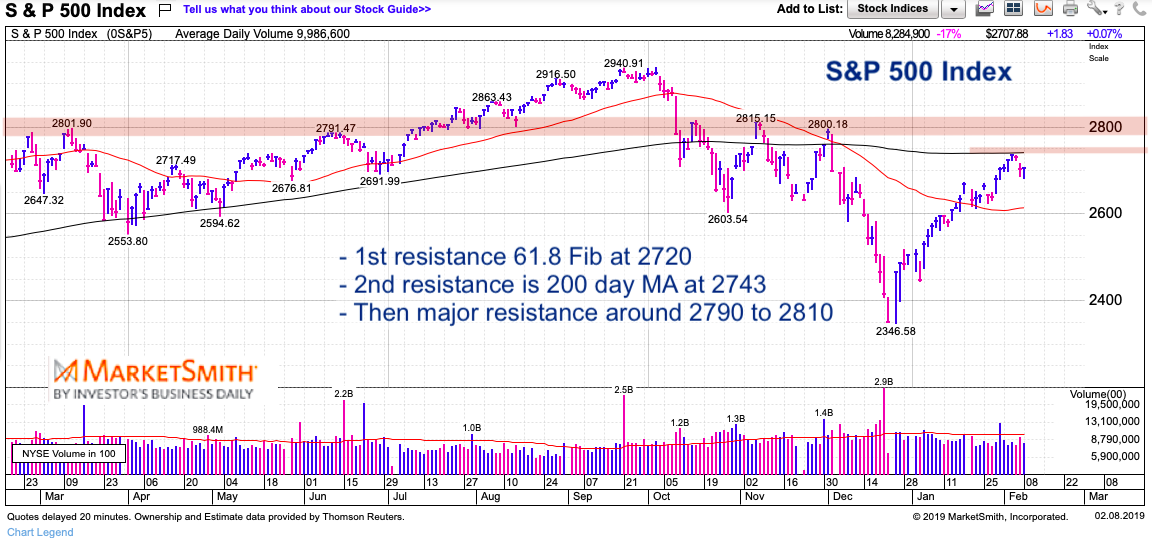
The rally saw the S&P 500 briefly exceed its 61.8 Fibonacci resistance level (2720) last week, touching up near its 200 day moving average.
Considering that the market has rallied 16% in 6 weeks, investors should begin to tame their animal spirits and look to trade around gains.
Note that the following MarketSmith charts are built with Investors Business Daily’s product suite.
I am an Investors Business Daily (IBD) partner and promote the use of their products. The entire platform offers a good mix of technical and fundamental data and education.
S&P 500 Daily Chart
The broad market index should test its 200 day moving average again. This is a major psychological barrier, followed by many traders/investors.
What this means is that price will either respect the barrier and struggle to over take it, eventually giving way to a pullback.
OR it will poke its head above the level and quickly race up toward the 2790 resistance level before reversing for a pullback back below the 200 day moving average. It’s common for an asset to poke its head above a key level and say “look at me” before realizing that it’s premature to take that level out.
Twitter: @andrewnyquist
The author does not have a position in mentioned securities at the time of publication. Any opinions expressed herein are solely those of the author, and do not in any way represent the views or opinions of any other person or entity.

 Rolling Over At Key Fibonacci Level?")


