S&P 500 Index – Key Trading Levels & Considerations
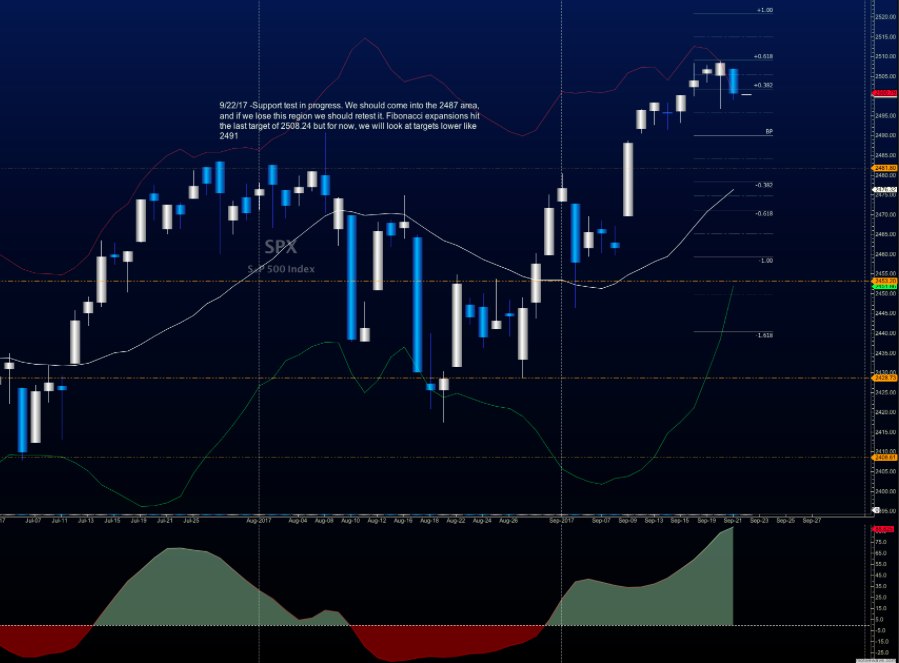
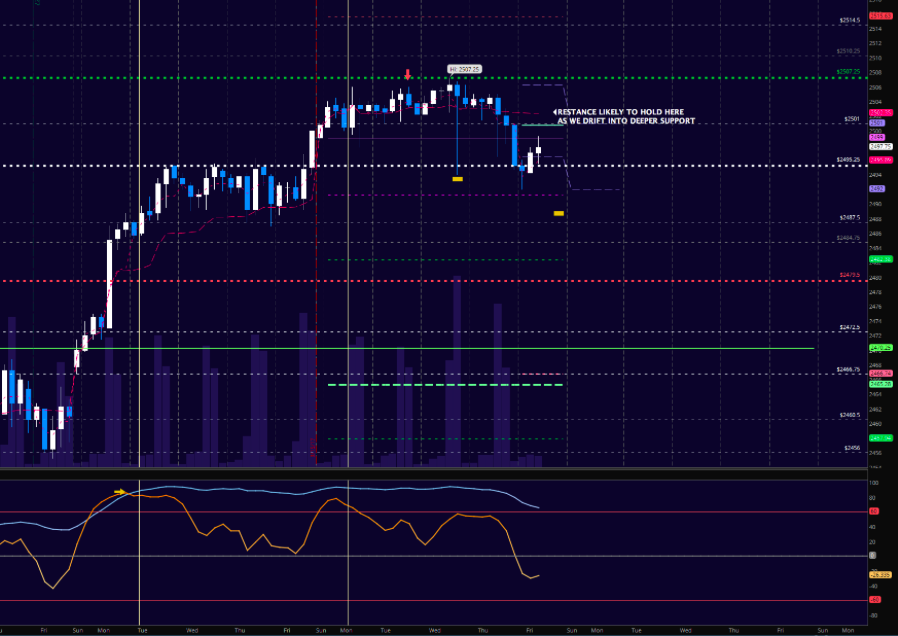
The S&P 500 Index (INDEXSP:.INX) is set to gap down into support at the open. Fades into support are likely today.
Here’s a list of trading support/resistance levels to watch today:
- Bounces are likely to reject at resistance at lower highs.
- 2496 and 2491 are key “near-term” trading support levels.
- Failure to breach higher yesterday was our “tell”.
- Watch for a failure to recapture prior support at 2498.
- So far, we are holding the space of upside, so shorting here in the swing will likely be premature.
There are a lot of buyers holding regions near deeper support levels (namely 2479). So watch this level is selling pressure picks up.
S&P 500 Futures – At A Glance
Similar to the cash index but a couple points off due to futures. Looking at 2502-2506 as initial resistance and 2489-2494 as initial support.
As long as the trader keeps himself aware of support and resistance levels, risk can be very adequately managed to play in either direction as bottom picking remains a behavior pattern that is developing with value buyers and speculative traders. Thanks for reading.
Twitter: @AnneMarieTrades
The author trades stock market futures every day and may have a position in mentioned securities at the time of publication. Any opinions expressed herein are solely those of the author, and do not in any way represent the views or opinions of any other person or entity.


