S&P 500 Trading Outlook (3-5 Days): Bearish
Look to sell rallies with a move down to test the 2710 area initially. Bulls need to see an advance back over 2764 to think any sort of low is in place.
The S&P 500 attempted a couple of different rallies yesterday before pulling back to within striking distance of lows and initial support near 2710.
This pattern be in order once again today.
Note that 2710 is the 50 percent Fibonacci retracement level from late October and is considered the first real area to consider covering shorts and attempting to buy. Yesterday’s early rally failed to take breadth that much higher, which is still negative while prices closed right near recent lows.
Again, this still looks early to think that any sort of low of magnitude is in place.
However, there are some encouraging signs that need to be mentioned that were not n place last week. First, hourly charts are beginning to show positive breadth divergence, given yesterdays early rally attempt. Market breadth and momentum improved on the pullback and did not make new lows. Second, counter-trend indications of exhaustion are nearly complete on hourly S&P charts. Third, Financials have shown some ability to stabilize and rally in recent days, bucking the trend at a time when rallies in this group are sorely needed.
Finally, near-term market cycles suggest that November 15th or 16th could be a low for stocks. Therefore, while the trend is indeed still down for US stock market indices, there should be some attempt at stabilizing and rallying into the shortened holiday week next week.
S&P 500 Daily Chart
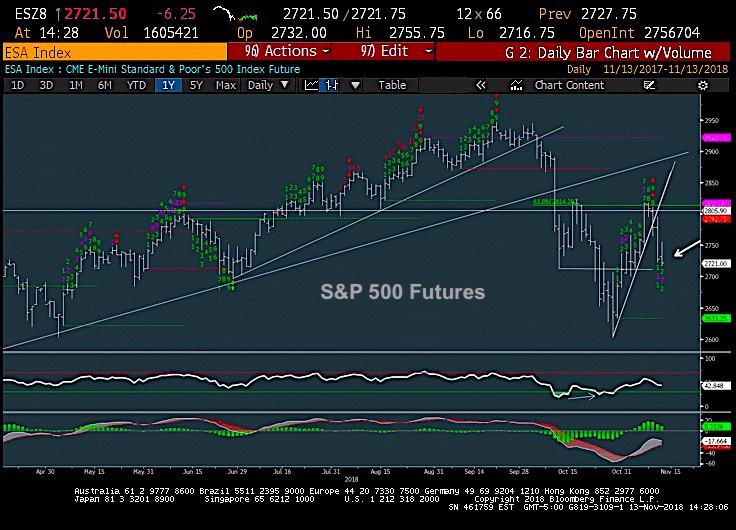
The S&P 500’s daily chart shows the extent of this recent drawdown, which nearly lines up perfectly with the prior lows made in mid-October. While it’s much too early to have any kind of thoughts on a Reverse Head and Shoulders pattern in the making for S&P, i’m incline to think this very well might be possible if sentiment continues to deteriorate at this same pace. Recent TRIN readings have escalated, showing far more volume into “down” vs “up” stocks, and Equity Put/call ratio looks to be consolidating on the verge of a final push higher.
Overall, trends remain down, yet risk/reward doesn’t look as appealing between Wednesday and Friday for shorts. One should utilize movement down to the 50% retracement zone near 2710 to consider covering at least partial shorts and then allow markets a chance to stabilize a bit.
If you have an interest in seeing timely intra-day market updates on my private twitter feed, please follow @NewtonAdvisors. Also, feel free to send me an email at info@newtonadvisor.com regarding how my Technical work can add alpha to your portfolio management process.
Twitter: @MarkNewtonCMT
Author has positions in mentioned securities at the time of publication. Any opinions expressed herein are solely those of the author, and do not in any way represent the views or opinions of any other person or entity.


