December is here, and historically this is a time for stock market bulls to cheer!
Since 1950, the calendar month of December has closed higher 75.38% of the time with average returns of 1.67% (using the S&P 500 as a proxy). The average monthly draw up for December the last 65 years, as defined by measuring December’s high from November’s close, is 3.22%. With Monday’s close at 2,080.41, this would target a December high of 2,147.39.
S&P 500 Outlook Into Year-End
If history is any guide, it’s reasonable to expect new all time highs in December.
Will these highs demonstrate sustainability? That’s the trillion-dollar question. December’s average drawdown, as defined by measuring December’s low from November’s close, is -2.24%. However, the median December drawdown is just -1.28%. Normalized December weakness would target a December low anywhere from 2,033 to 2,053. A pullback to this price level is not a reason to call a top, panic, or think the next correction is underway.
BUT… There’s also evidence to suggest December’s full calendar month returns may be below average given positive monthly returns in October & November. Since 1950, there have been 22 calendar years where October and November’s monthly returns were positive. December’s monthly returns are subsequently higher in just 14 of 22 instances, a 63.63% win rate. December’s average monthly returns in these 22 samples is just 0.80%, which is less than half of December’s historical average return. This would target December’s monthly close at 2,097, a level just slightly below our all-time high monthly close at 2,107.39 from May. While this isn’t necessarily bearish, it may weigh on the bullish S&P 500 outlook for December.
As well, when we begin December on a two month winning streak, the month’s win rate, average return, and median return are well below historical averages. Perhaps the strength in October and November pulls forward some of December’s historical return and resolves in a mildly bullish bias on the S&P 500 outlook into year-end.
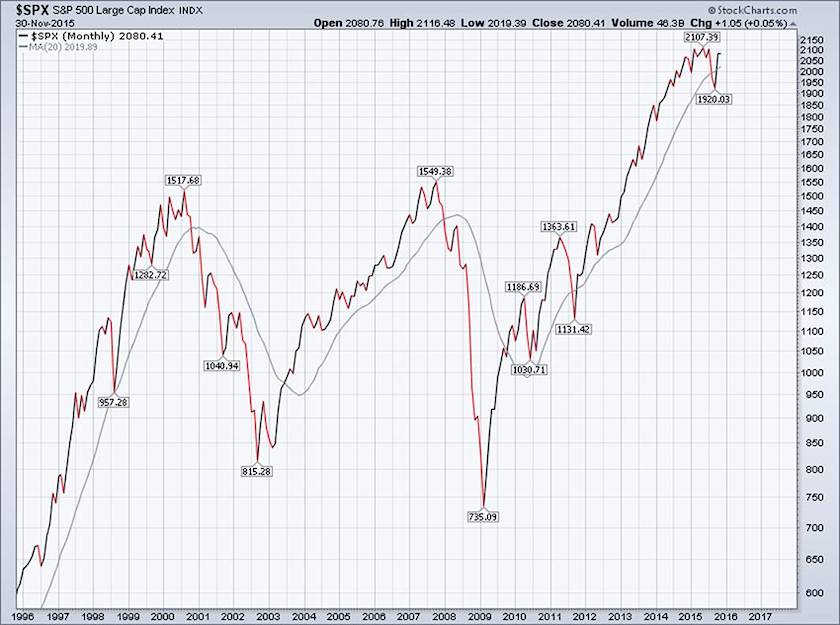
Looking at the forest, not the trees, the primary stock market trend remains… trendless. While the S&P 500 closed the month of November above its 20-month simple moving average, it’s yet to decisively breakout above resistance in the ~2,120-2,130 price region. Looking ahead, should December experience its average draw up and drawdown, we’ll see fresh all time highs on the daily chart, and a higher high and higher low on the monthly chart. This would then mark the third consecutive month in which the S&P 500 Index established higher highs and higher lows, the epitome of a primary uptrend. This would go a long way in reconfirming the primary trend as up or “bullish”. Wouldn’t that be a nice gift from Santa?
S&P 500 Index – Monthly Chart
Thanks for reading.
Twitter: @SJD10304
The author has positions in S&P 500 related securities at the time of publication. Any opinions expressed herein are solely those of the author, and do not in any way represent the views or opinions of any other person or entity.
")


