Midday Stock Market Trading Update – March 14, 2018
The dips were deeper yesterday and the pullback continued this morning amidst a move to deeper support (around 2767 on the S&P 500). Once this area was tested and recovered, we now look at old support being challenged as new resistance.
If 2767 fails to hold as support, this would send the S&P 500 into a deeper retrace that would continue the current countertrend pullback within the bigger picture.
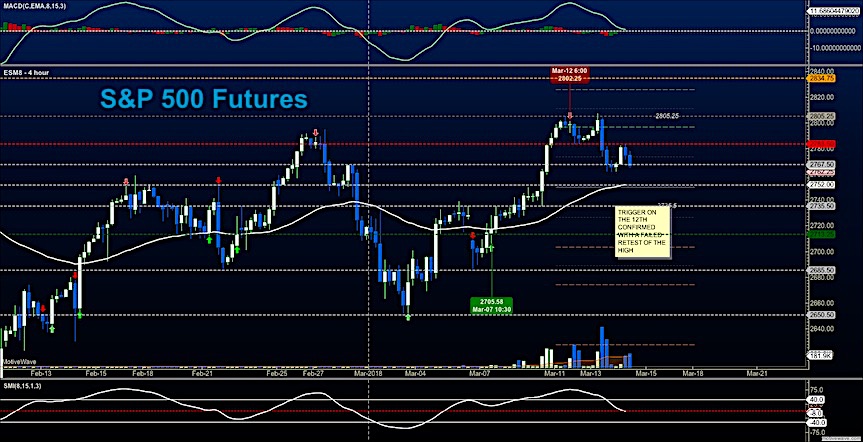
S&P 500 Futures
A deep fade brought us to look at resistance near 2783.5 between yesterday and today’s motion. We seem to be in a weak bounce pattern intraday and below 2760, we have support at 2751 and 2735. The bigger picture is still bullish and traders are becoming using to the sharp pullbacks that recover and are waiting accordingly for the dust to settle. The bullets below represent the likely shift of trading momentum at the positive or failed retests at the levels noted.
- Buying pressure intraday will likely strengthen with a bullish retest of 2784.50
- Selling pressure intraday will likely strengthen with a bearish retest of 2761.50
- Resistance sits near 2779.75 to 2786.5, with 2800.75 and 2811.75 above that.
- Support sits between 2763.5 and 2752.75, with 2735.25 and 2726.50.
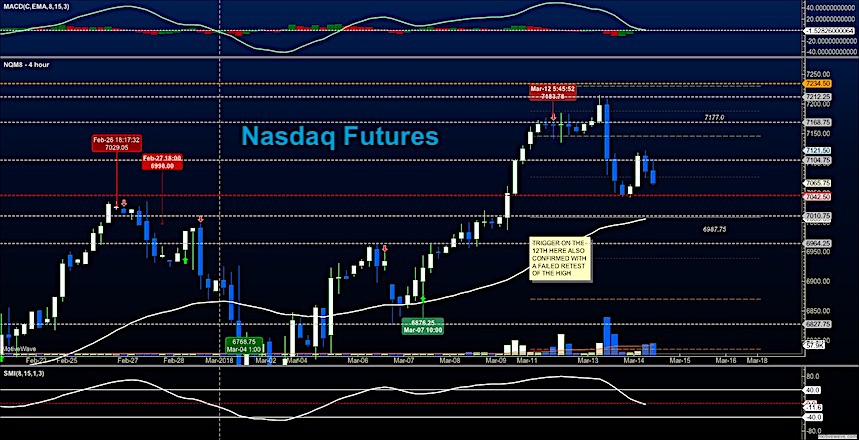
NASDAQ Futures
Failed retests of highs pushed NQ_F more than 120 lower since yesterday’s highs into the deep support I mentioned in yesterday’s blog post near 7045. Momentum is still quite bullish on larger time frames and pullbacks, though deep, are still likely to be bought here in the big picture. The level near 7140 is now intraday resistance, and a break below 7040 will likely give us a press into levels below 7000. The bullets below represent the likely shift of intraday trading momentum at the positive or failed tests at the levels noted.
- Buying pressure intraday will likely strengthen with a bullish retest of 7112.5
- Selling pressure intraday will likely strengthen with a bearish retest of 7059
- Resistance sits near 7104.75 to 7121.5 with 7149.5 and 7202.5 above that.
- Support sits between 7060.5 and 7042.75, with 7010.75 and 6987.75 below that.
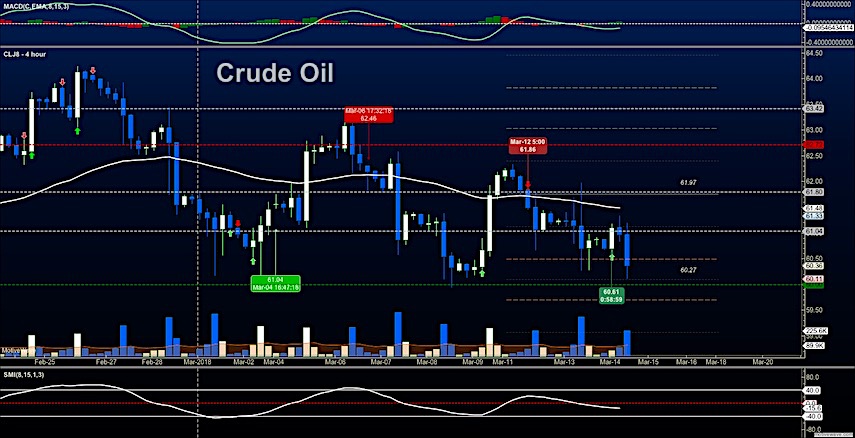
WTI Crude Oil
The drift into support near 60 for the second day could spell a break of this level but if it does break it will be very messy – as many traders are set to buy here at the very important support level. If this level definitively breaks, we will have a big fade into much deeper support. Big traders continue to trim their bullish stance The bullets below represent the likely shift of intraday trading momentum at the positive or failed tests at the levels noted.
- Buying pressure intraday will likely strengthen with a bullish retest of 61.56
- Selling pressure intraday will strengthen with a bearish retest of 59.92
- Resistance sits near 61.3 to 61.48, with 61.86 and 62.05 above that.
- Support holds near 60.11 to 59.71, with 59.58 and 59.16 below that.
Twitter: @AnneMarieTrades
The author trades stock market futures every day and may have a position in mentioned securities at the time of publication. Any opinions expressed herein are solely those of the author, and do not in any way represent the views or opinions of any other person or entity.


")


