Broad Stock Market Futures Outlook for April 12, 2018
The nightmare scenario for swing traders continues with the reversals at deep edges continuing across the broad stock market indices. With earnings season upon us again, we expect to see these edges tested and expanded, but in the end, stocks may continue to collapse into congestion.
Traders can use intraday motion to move from support to resistance and vice versa in any of the stock market futures indices today – with an eye on the fact the edges may very well reverse.
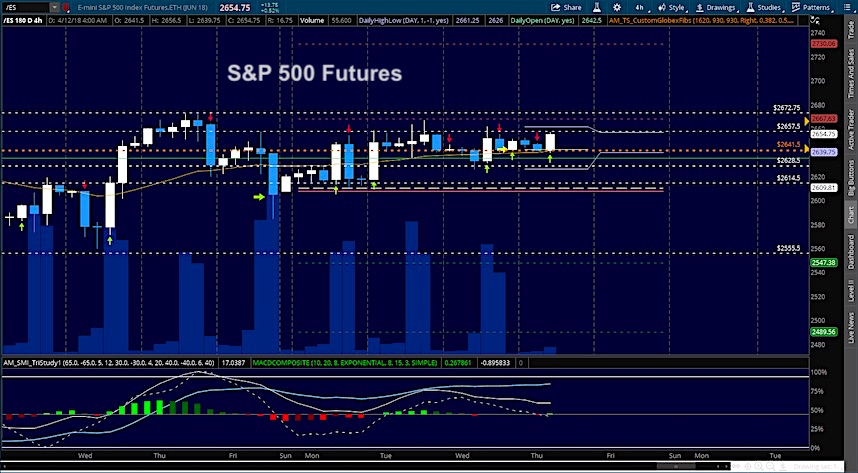
S&P 500 Futures
Support held yesterday near 2628 with a new line in the sand near 2642 as we have higher lows this morning. Our intraday drift is mildly positive so pullbacks are likely to be buying regions for traders. Sellers will have much more control below 2635 today. The bullets below represent the likely shift of trading momentum at the positive or failed retests at the levels noted.
- Buying pressure intraday will likely strengthen with a bullish retest of 2642.75
- Selling pressure intraday will likely strengthen with a bearish retest of 2635.50
- Resistance sits near 2657.75 to 2667.75, with 2674.25 and 2686.75 above that.
- Support sits between 2639 and 2628.5, with 2614.5 and 2604.50
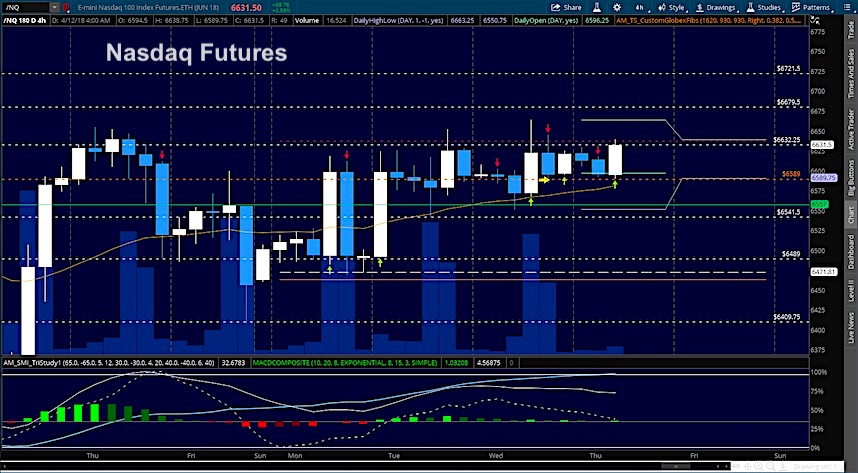
NASDAQ Futures
Momentum continues to hold bullish here in the recovery of this chart beaten up by the news. The line in the sand today sits near 6589.75 – the low of the morning, where buying pressure is building from a bullish space. Pullbacks are buying zones as long as we hold above 6590. Resistance is being tested here and should fade into higher lows at the first pass. The bullets below represent the likely shift of intraday trading momentum at the positive or failed tests at the levels noted.
- Buying pressure intraday will likely strengthen with a bullish retest of 6652.75
- Selling pressure intraday will likely strengthen with a bearish retest of 6589
- Resistance sits near 6634.5 to 6659.5 with 6682.5 and 6727.25 above that.
- Support sits between 6604.5 and 6589.75, with 6557.25 and 6489.75 below that.
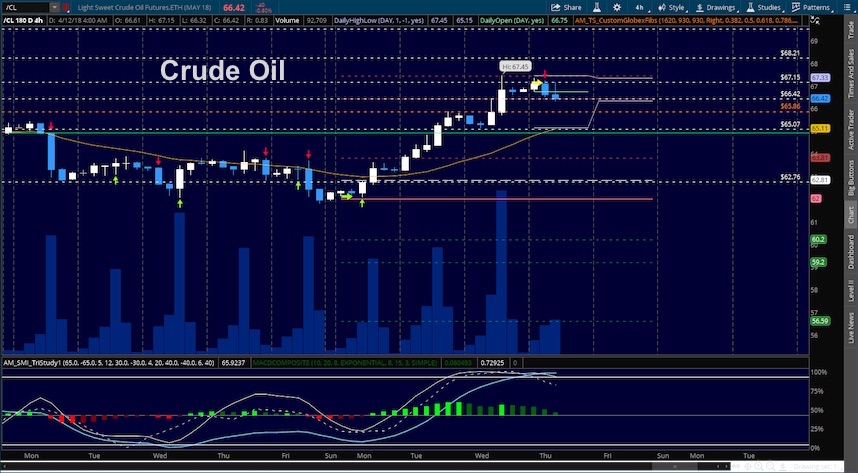
WTI Crude Oil
Higher lows and higher highs drove traders right into resistance from last year and stalled near 67.44 (a target we had from yesterday). Bullish pressure is once again present and pullbacks to support on the first pass will be buying zones but we are also potentially at the tipping point for the highs as they retest. Watch support as well as the failure to make new highs as caution signals for traders ( we are currently seeing this ). The bullets below represent the likely shift of intraday trading momentum at the positive or failed tests at the levels noted.
- Buying pressure intraday will likely strengthen with a bullish retest of 67.18
- Selling pressure intraday will strengthen with a bearish retest of 65.86
- Resistance sits near 67.15 to 67.44, with 68.21 and 68.42 above that.
- Support holds near 66.37 to 65.86, with 65.24 and 63.84 below that.
Twitter: @AnneMarieTrades
The author trades stock market futures every day and may have a position in mentioned securities at the time of publication. Any opinions expressed herein are solely those of the author, and do not in any way represent the views or opinions of any other person or entity.
 Rolling Over At Key Fibonacci Level?")


