Stock Market Considerations For October 20, 2017
The S&P 500 (INDEXSP:.INX) and Nasdaq (INDEXNASDAQ:.IXIC) are trading higher this morning following a strong “buy the dip” performance yesterday. See our key trading levels for the S&P 500, Nasdaq, and crude oil below.
Check out today’s economic calendar with a full rundown of releases. And note that the charts below are from our premium service and shared exclusively with See It Market readers.
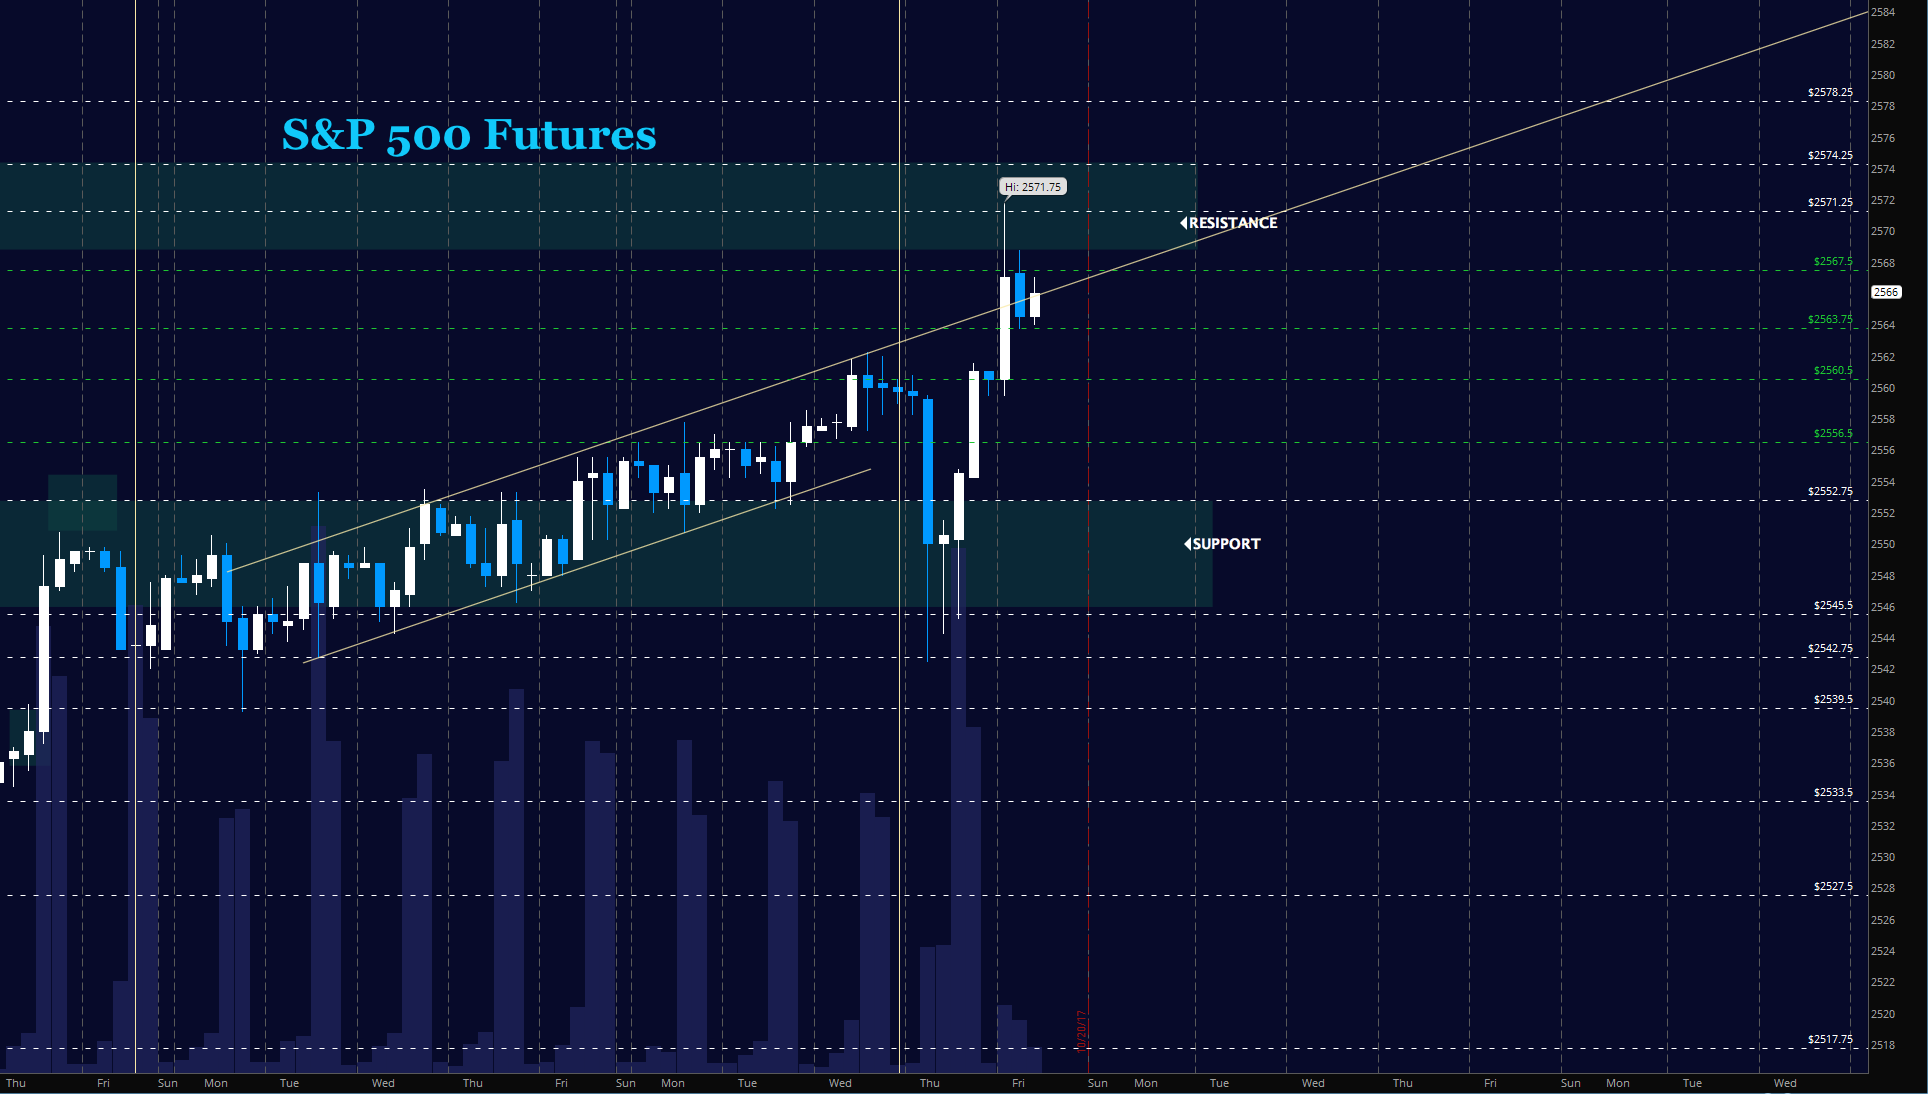
S&P 500 Futures (ES)
Buyers continue undaunted in the market that simply just recovers. Traders continue to buy pullbacks in the current formation but I will continue to suggest some measure of caution with size as we are likely to have a little more range in motion. The bullets below represent the likely shift of trading momentum at the positive or failed retests at the levels noted.
- Buying pressure intraday will likely strengthen above a positive retest of 2567.5
- Selling pressure intraday will likely strengthen with a failed retest of 2560.5
- Resistance sits near 2567.5 to 2571.5, with 2574.75 and 2578.25 above that.
- Support holds between 2563.5 and 2560.5, with 2556.75 and 2547.75 below that.
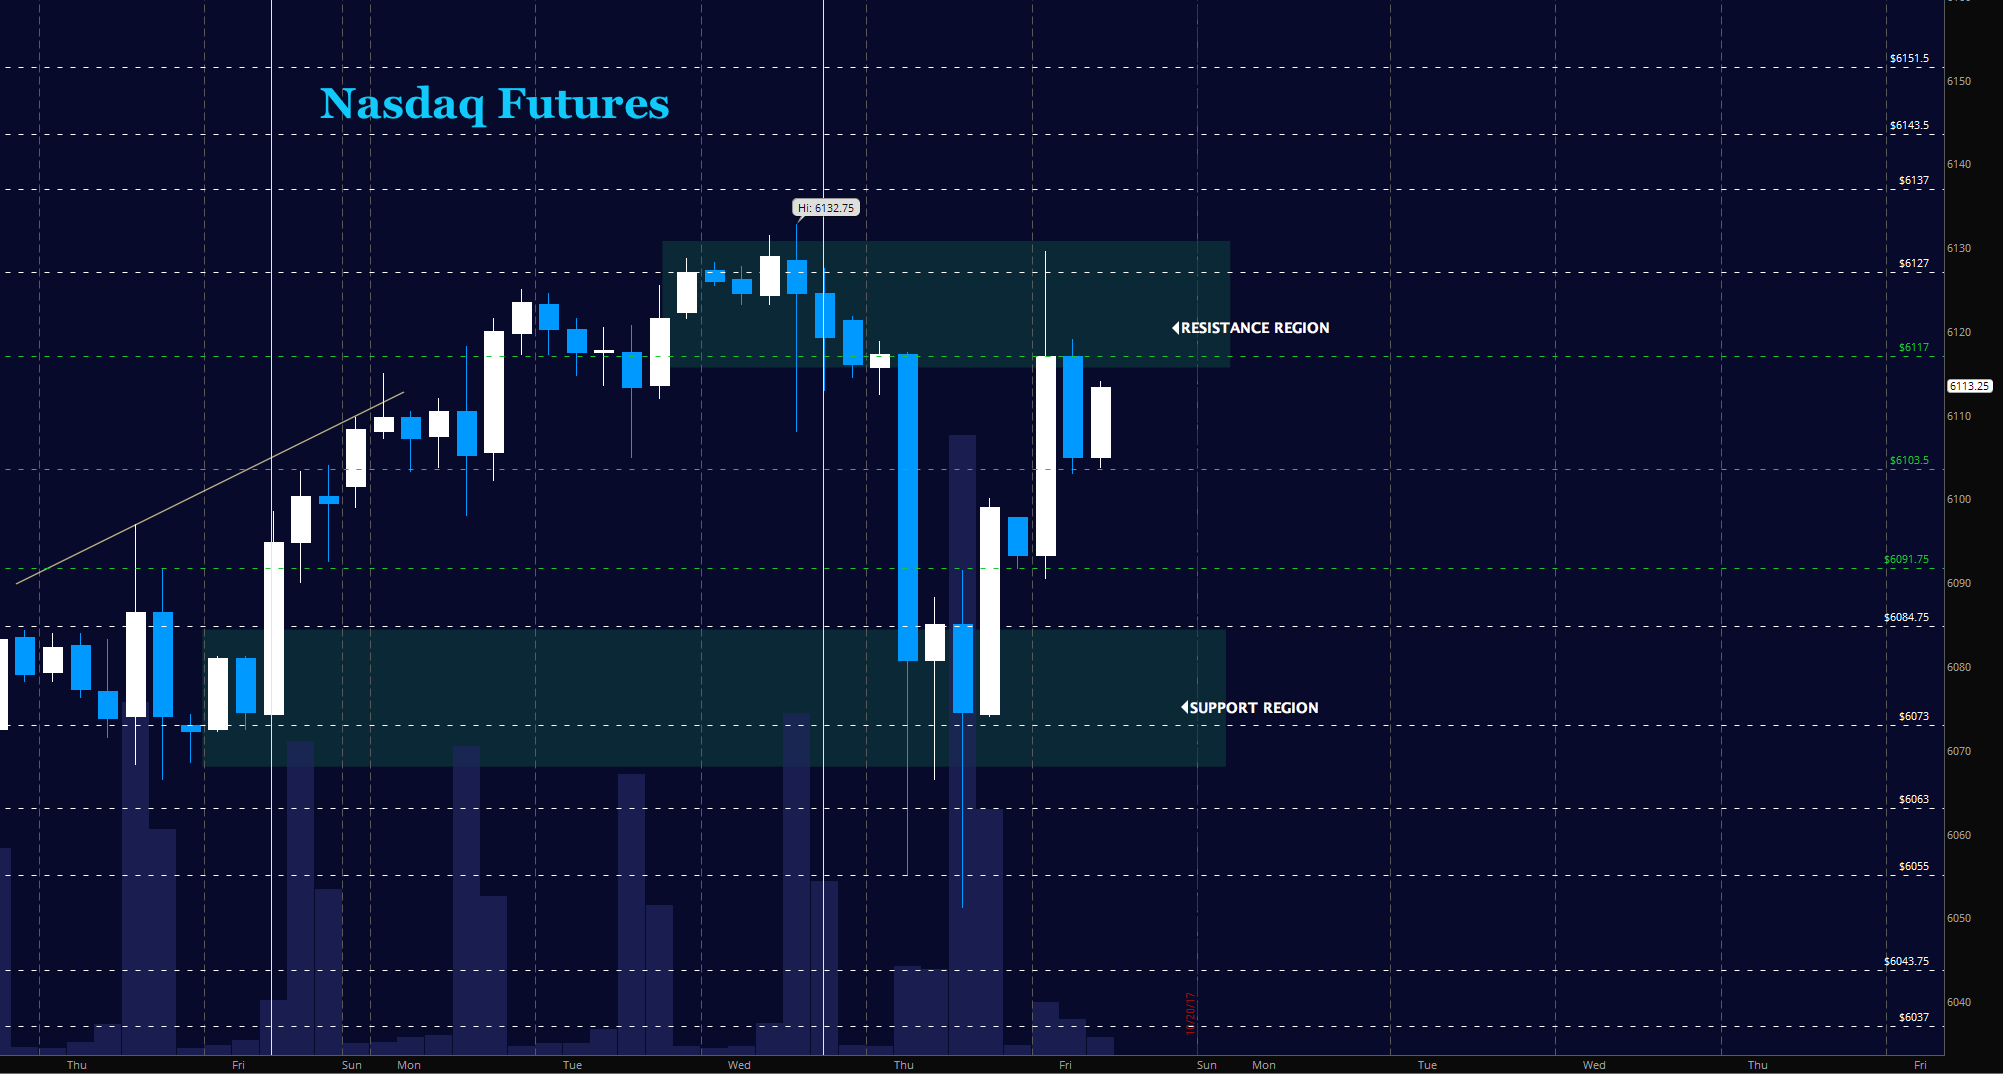
NASDAQ Futures (NQ)
Charts recovered in a topping formation early but are now at the bottom of key support regions. Holding familiar support near 6104 will be key this morning as traders hold sellers at bay. The bullets below represent the likely shift of intraday trading momentum at the positive or failed tests at the levels noted.
- Buying pressure intraday will likely strengthen with a positive retest of 6117.5
- Selling pressure intraday will likely strengthen with a failed retest of 6103.5
- Resistance sits near 6117.5 to 6127.5 with 6132.5 and 6137.75 above that.
- Support holds between 6103.5 and 6091.5, with 6078.5 and 6055 below that.
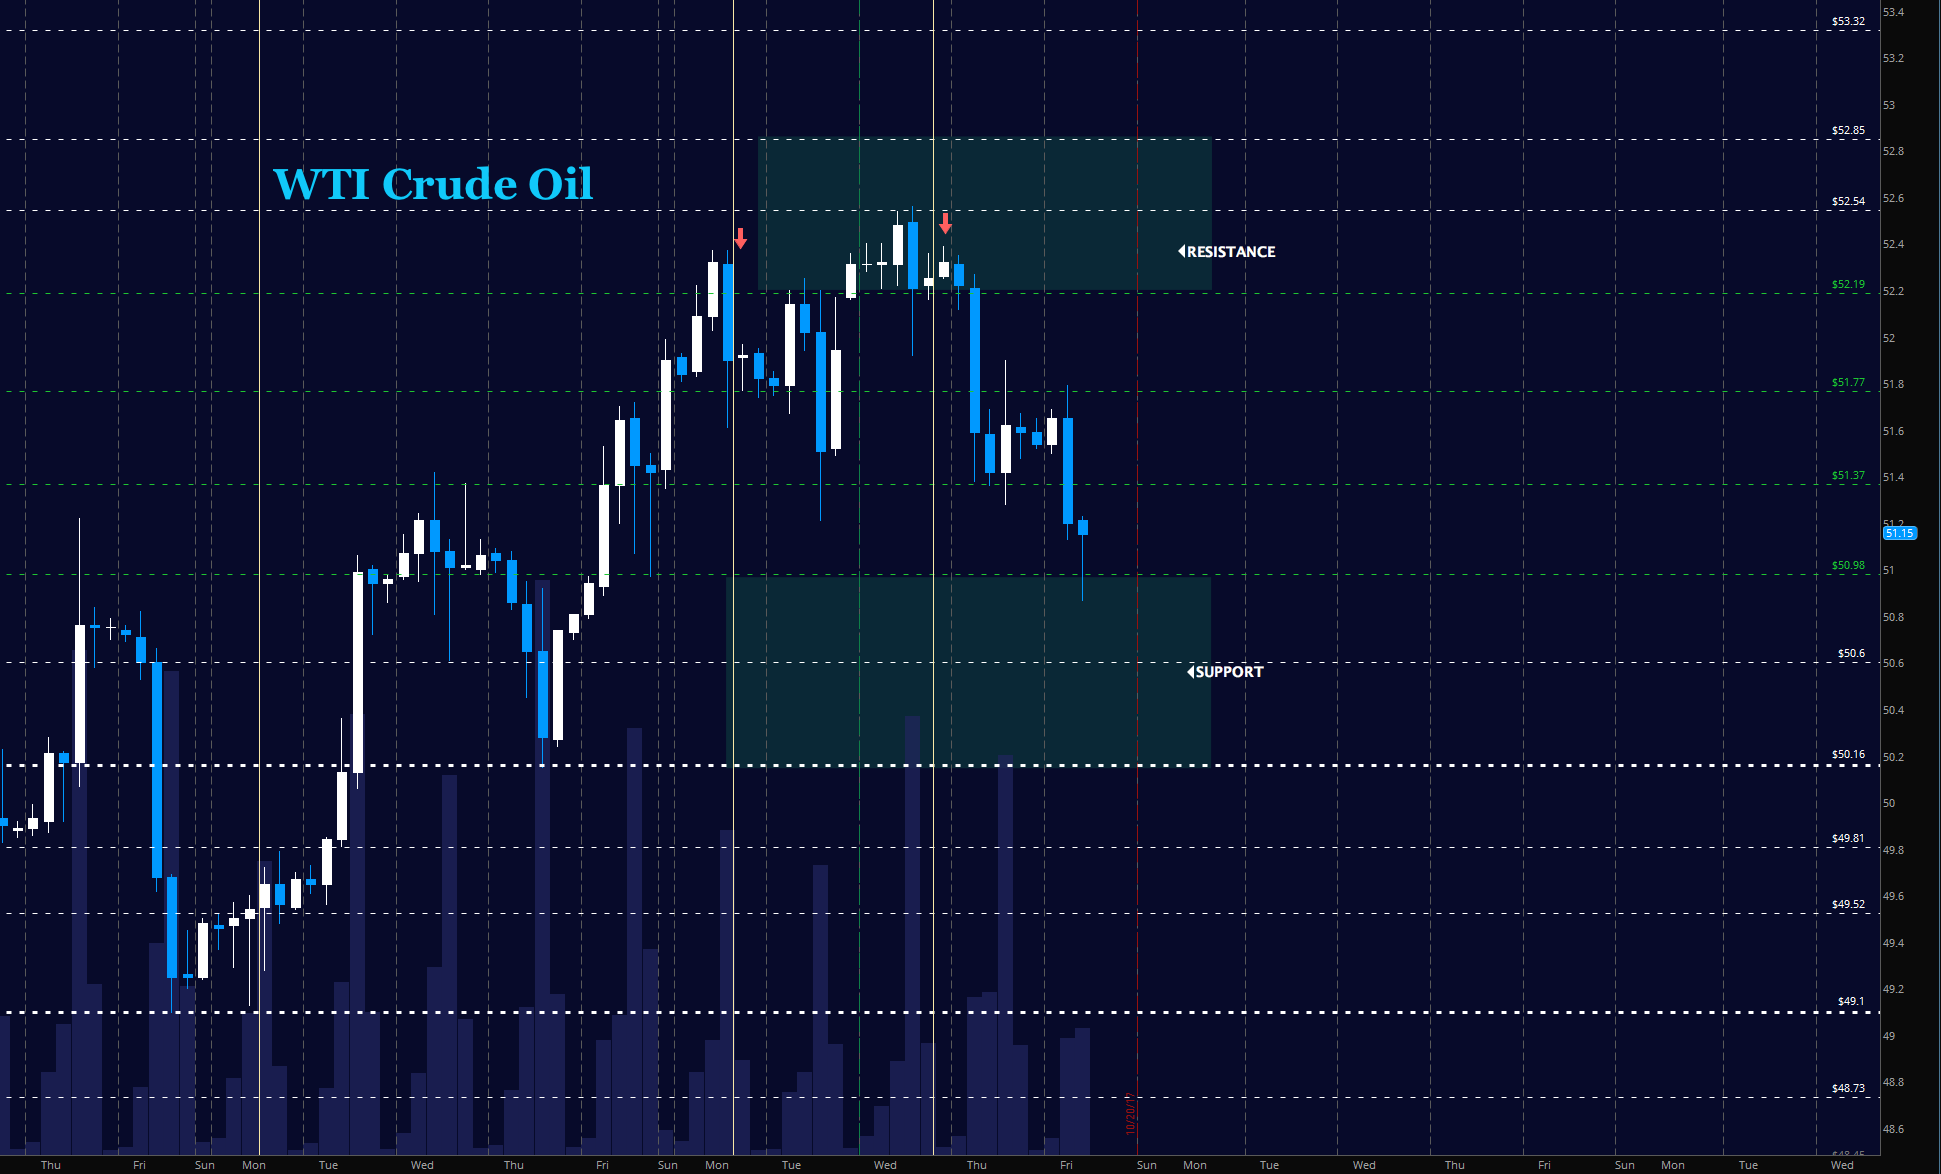
WTI Crude Oil
Oil continues to chop in the wide region between 50 and 52. Deeper pullbacks are still likely to find buyers and sharp moves upward are likely to find sellers. Key support could be lower today as the test of 50 potentially looms. The bullets below represent the likely shift of trading momentum at the positive or failed tests at the levels noted.
- Buying pressure intraday will likely strengthen with a positive retest of 51.78
- Selling pressure intraday will strengthen with a failed retest of 50.87
- Resistance sits near 51.7 to 52.02, with 52.24 and 52.45 above that.
- Support holds between 50.87 to 50.6, with 50.16 and 49.8 below that.
If you’re interested in watching these trades go live, join us in the live trading room from 9am to 11:30am each trading day. Visit TheTradingBook for more information.
If you’re interested in the live trading room, it is now primarily stock market futures content, though we do track heavily traded stocks and their likely daily trajectories as well – we begin at 9am with a morning report and likely chart movements along with trade setups for the day.
As long as the trader keeps himself aware of support and resistance levels, risk can be very adequately managed to play in either direction as bottom picking remains a behavior pattern that is developing with value buyers and speculative traders.
Twitter: @AnneMarieTrades
The author trades stock market futures every day and may have a position in mentioned securities at the time of publication. Any opinions expressed herein are solely those of the author, and do not in any way represent the views or opinions of any other person or entity.

 Rolling Over At Key Fibonacci Level?")


