Stock Market Futures Considerations For May 11, 2017
Traders will want to be on there toes as the S&P 500 (NYSEARCA:SPY) looks set to test lower price support levels this morning. See below for ideas on where buyers may step in.
Check out today’s economic calendar with a full rundown of releases. And note that the charts below are from our premium service at The Trading Book and are shared exclusively with See It Market readers.
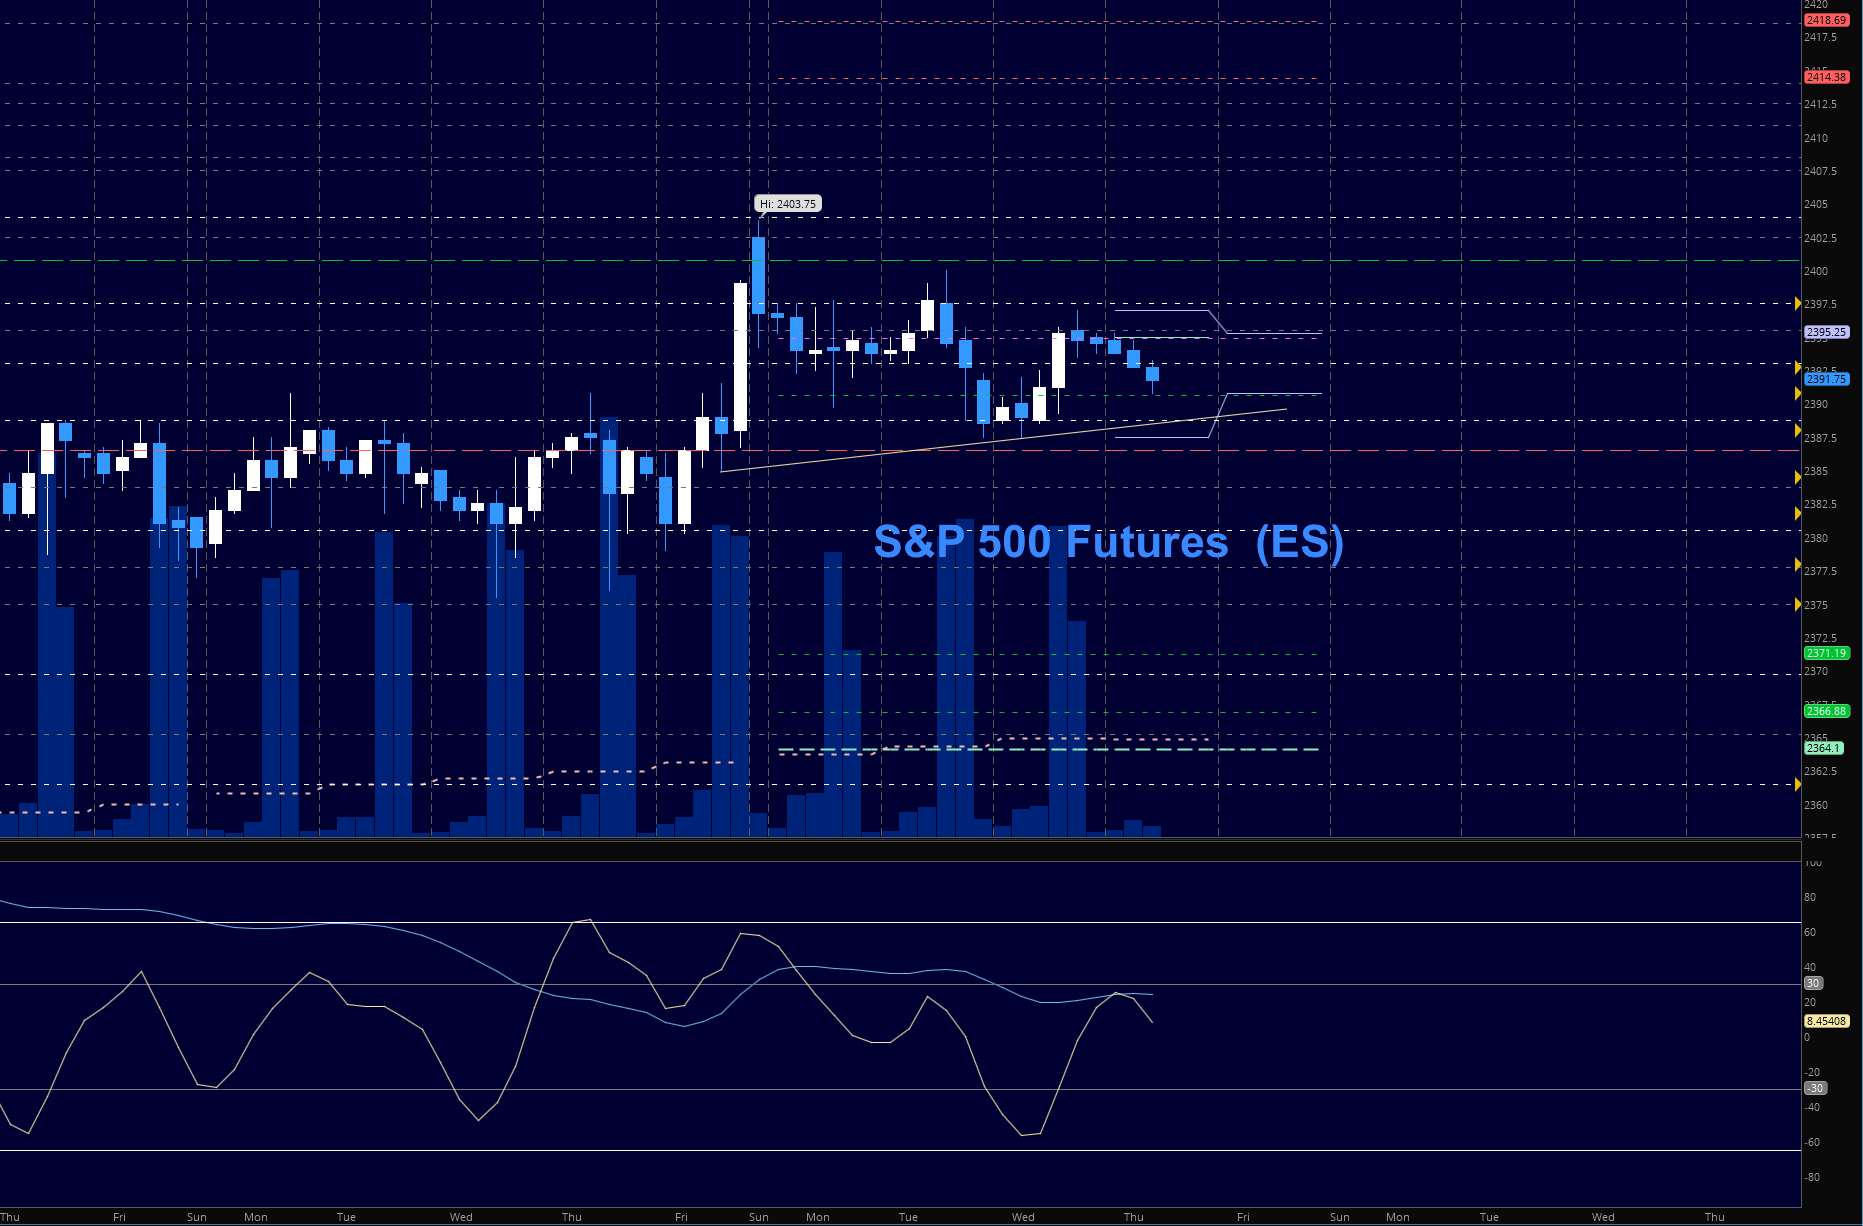
S&P 500 Futures (ES)
The level at 2392.5 is testing as resistance once again as charts have faded lower after a bounce to a lower high. Momentum suggests that buyers will be still be rewarded at support zones but a break below 2387 will be trouble for buyers unless they quickly recover. The bullets below represent the likely shift of trading momentum at the positive or failed tests at the levels noted – Levels near 2387 and 2397.5 are key battleground zones today.
- Buying pressure intraday will likely strengthen above a positive retest of 2396.75
- Selling pressure intraday will likely strengthen with a failed retest of 2386.5
- Resistance sits near 2392.5 to 2396.75, with 2403.75 and 2411.75 above that
- Support holds between 2386.5 and 2383.75, with 2380.5 and 2377.75 below that
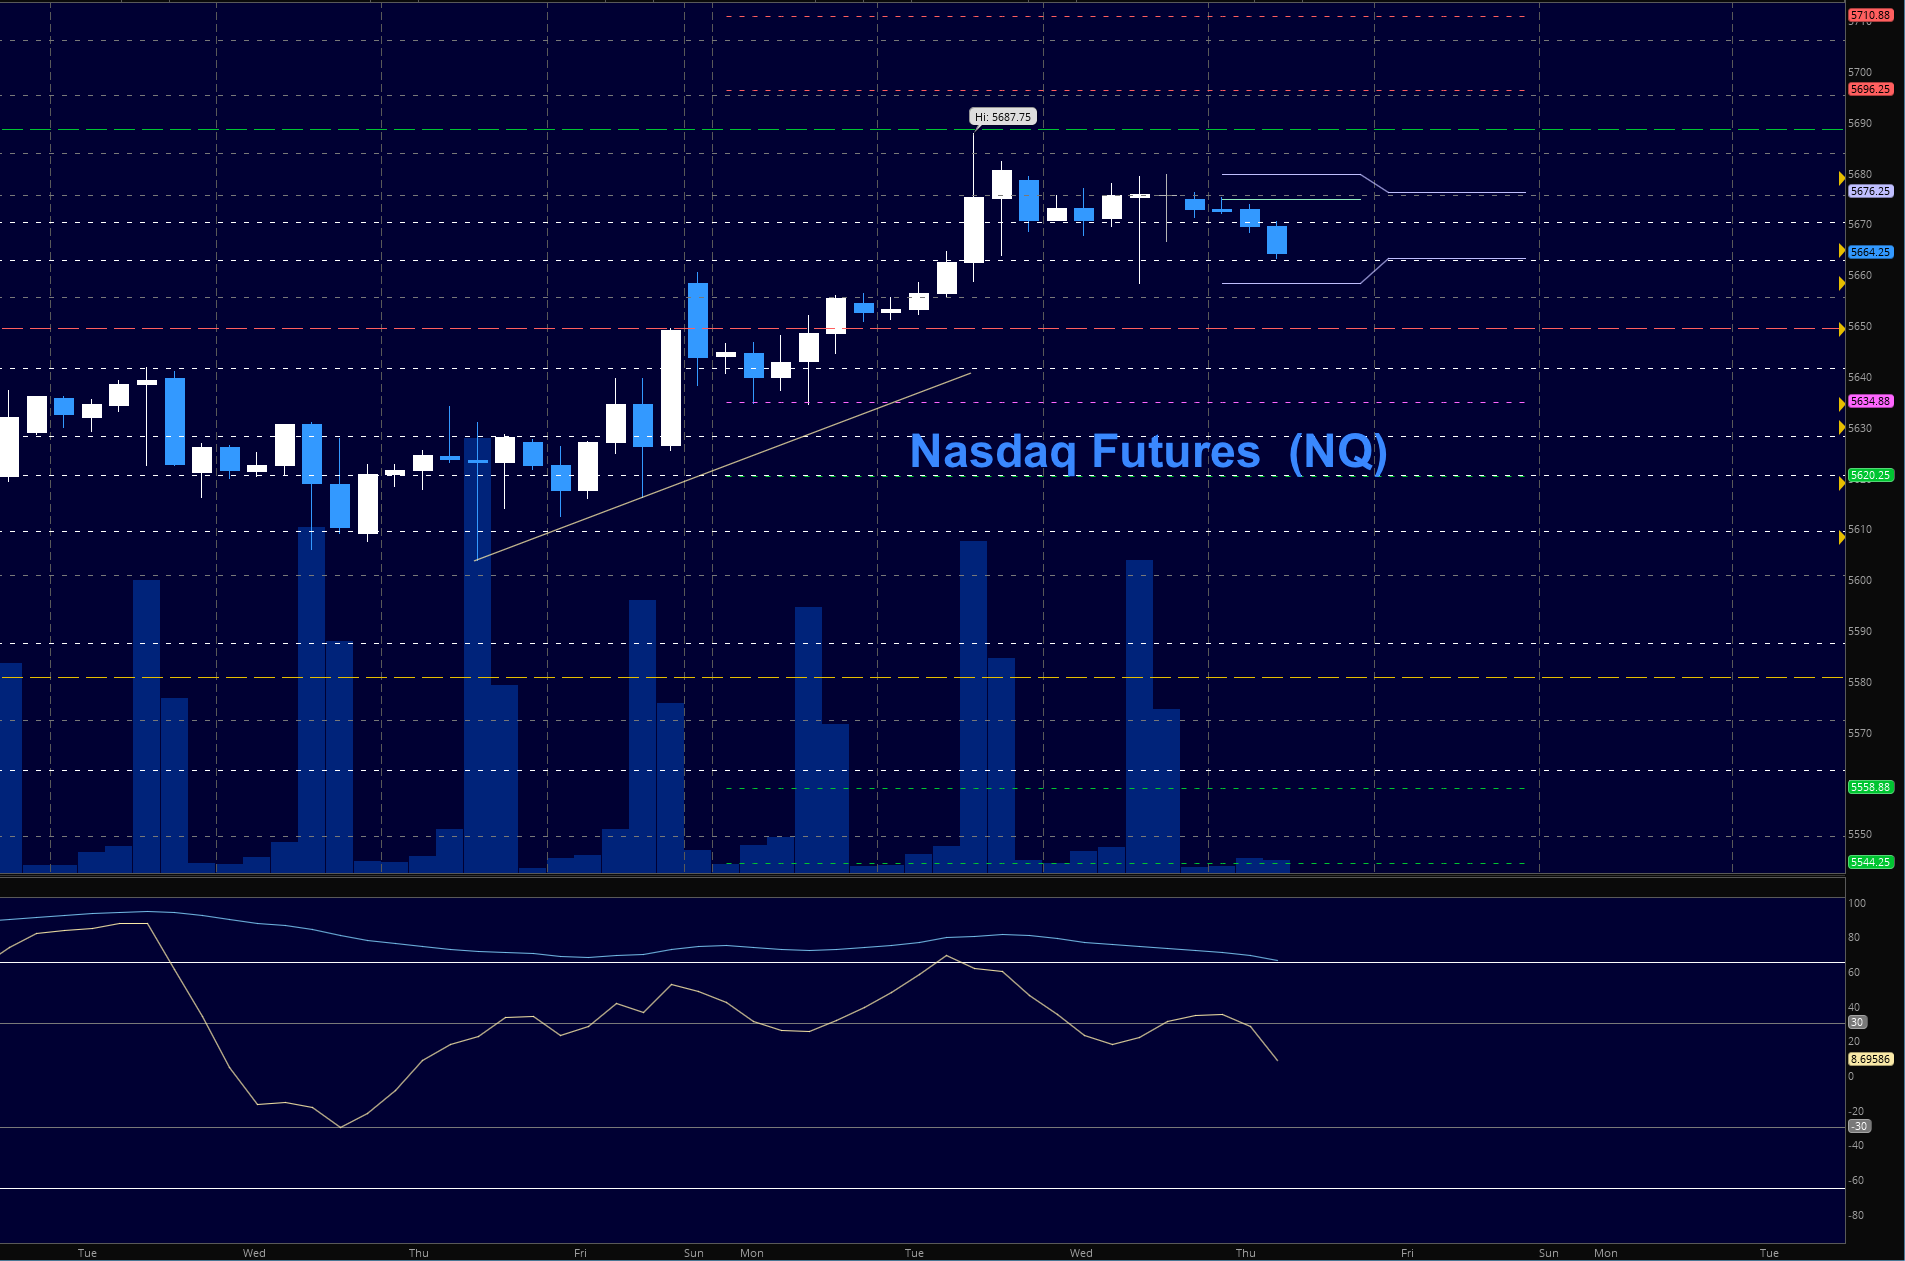
NASDAQ Futures (NQ)
As these charts retreat from the highs, value areas of support continue to be best for entries long, they just may be deeper. Another test of a lower high will likely yield an even deeper test below. The bullets below represent the likely shift of trading momentum at the positive or failed tests at the levels noted.
- Buying pressure intraday will likely strengthen with a positive retest of 5680.5
- Selling pressure intraday will likely strengthen with a failed retest of 5658
- Resistance sits near 5680.5 to 5685.25, with 5687.5 and 5695.25 above that
- Support holds between 5658.75 and 5649.5, with 5641.5 and 5630.5 below that
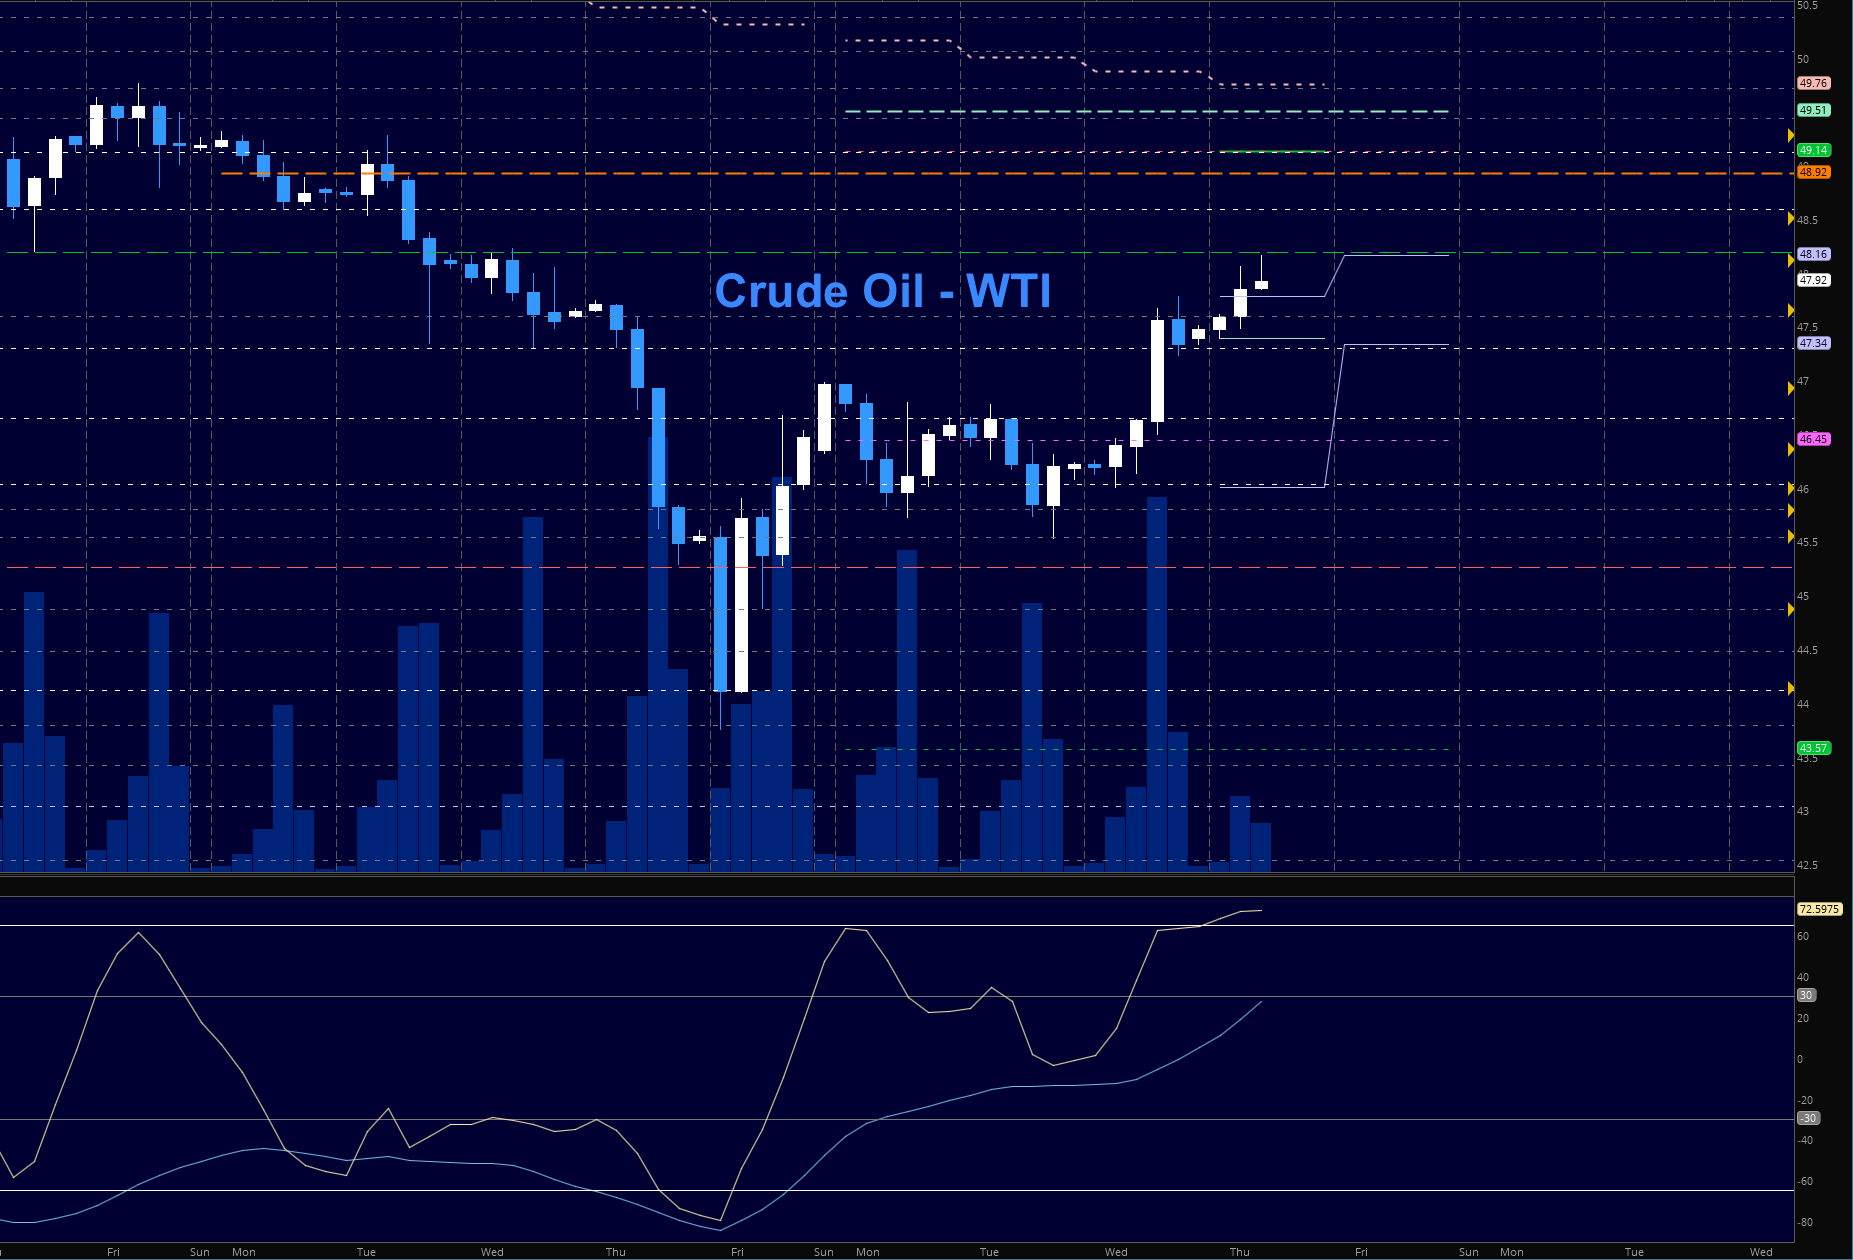
Crude Oil – WTI
The EIA report of a draw boosted prices back into resistance of 48.2, not seen in several days and after a deep dip into the test of 44. The level at 48.2 is quite strong resistance so first pass tests of this region should fade. The bullets below represent the likely shift of trading momentum at the positive or failed tests at the levels noted.
- Buying pressure intraday will likely strengthen with a positive retest of 48.26
- Selling pressure intraday will strengthen with a failed retest of 47.4
- Resistance sits near 48.2 to 48.6, with 48.92 and 49.12 above that.
- Support holds between 47.4 and 46.94, with 46.6 and 46.2 below that.
Our live trading room is now primarily stock market futures content, though we do track heavily traded stocks and their likely daily trajectories as well – we begin at 9am with a morning report and likely chart movements along with trade setups for the day.
As long as the trader keeps himself aware of support and resistance levels, risk can be very adequately managed to play in either direction as bottom picking remains a behavior pattern that is developing with value buyers and speculative traders.
Twitter: @AnneMarieTrades
The author trades stock market futures every day and may have a position in mentioned securities at the time of publication. Any opinions expressed herein are solely those of the author, and do not in any way represent the views or opinions of any other person or entity.


")