Stock Market Futures Trading Considerations For May 10, 2017
The S&P 500 (INDEXSP:.INX) and Nasdaq (INDEXNASDAQ:.IXIC) took a breather yesterday. But buyers should be found just beneath current levels. read more below.
Check out today’s economic calendar with a full rundown of releases. And note that the charts below are from our premium service at The Trading Book and are shared exclusively with See It Market readers.
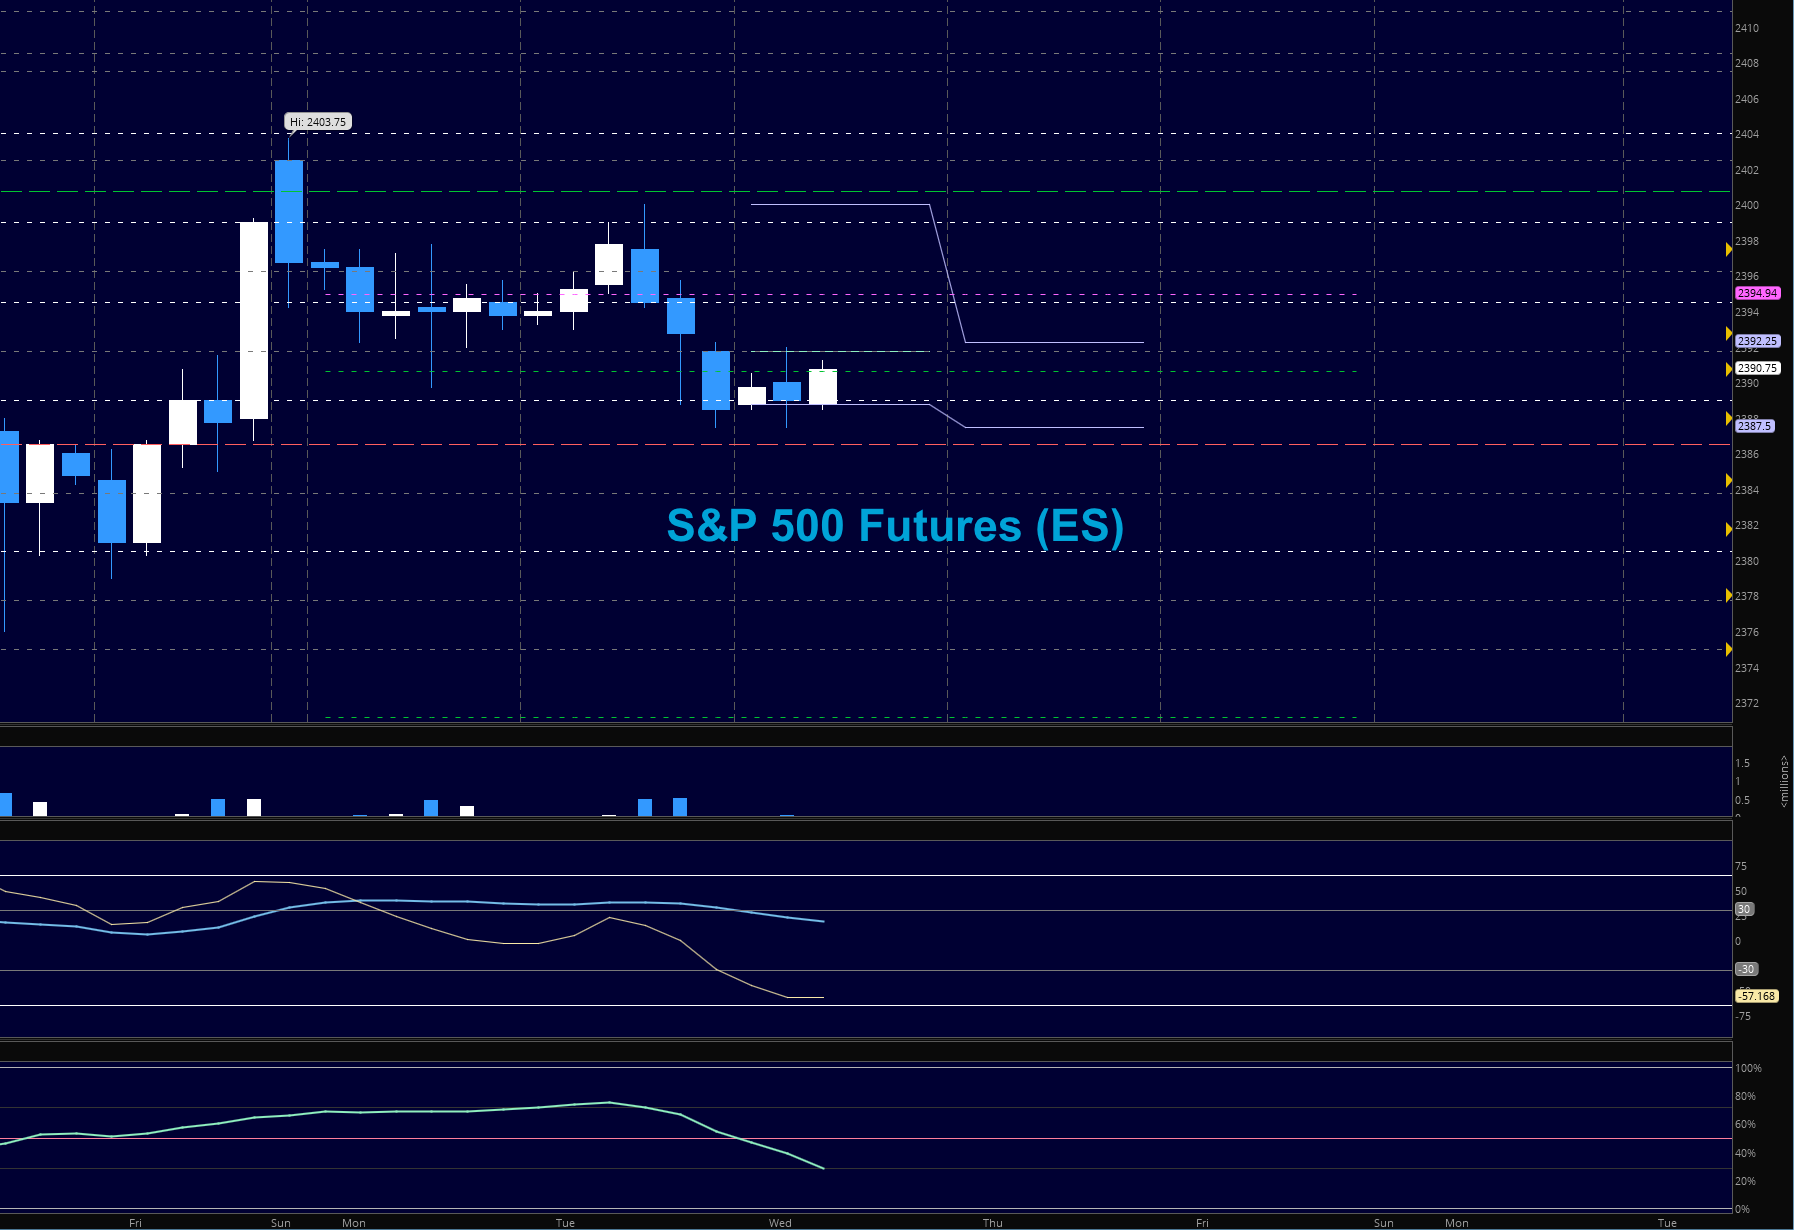
S&P 500 Futures (ES)
The level here at 2392.5 is testing as resistance as charts have faded lower. Momentum suggests that buyers will be rewarded at support zones but a break below 2388 will be trouble for buyers unless they quickly recover. The bullets below represent the likely shift of trading momentum at the positive or failed tests at the levels noted – Levels near 2388 and 2397.5 are key battleground zones today.
- Buying pressure intraday will likely strengthen above a positive retest of 2396.5
- Selling pressure intraday will likely strengthen with a failed retest of 2386.5
- Resistance sits near 2392.5 to 2397.5, with 2403.75 and 2411.75 above that
- Support holds between 2386.5 and 2383.75, with 2380.5 and 2377.75 below that
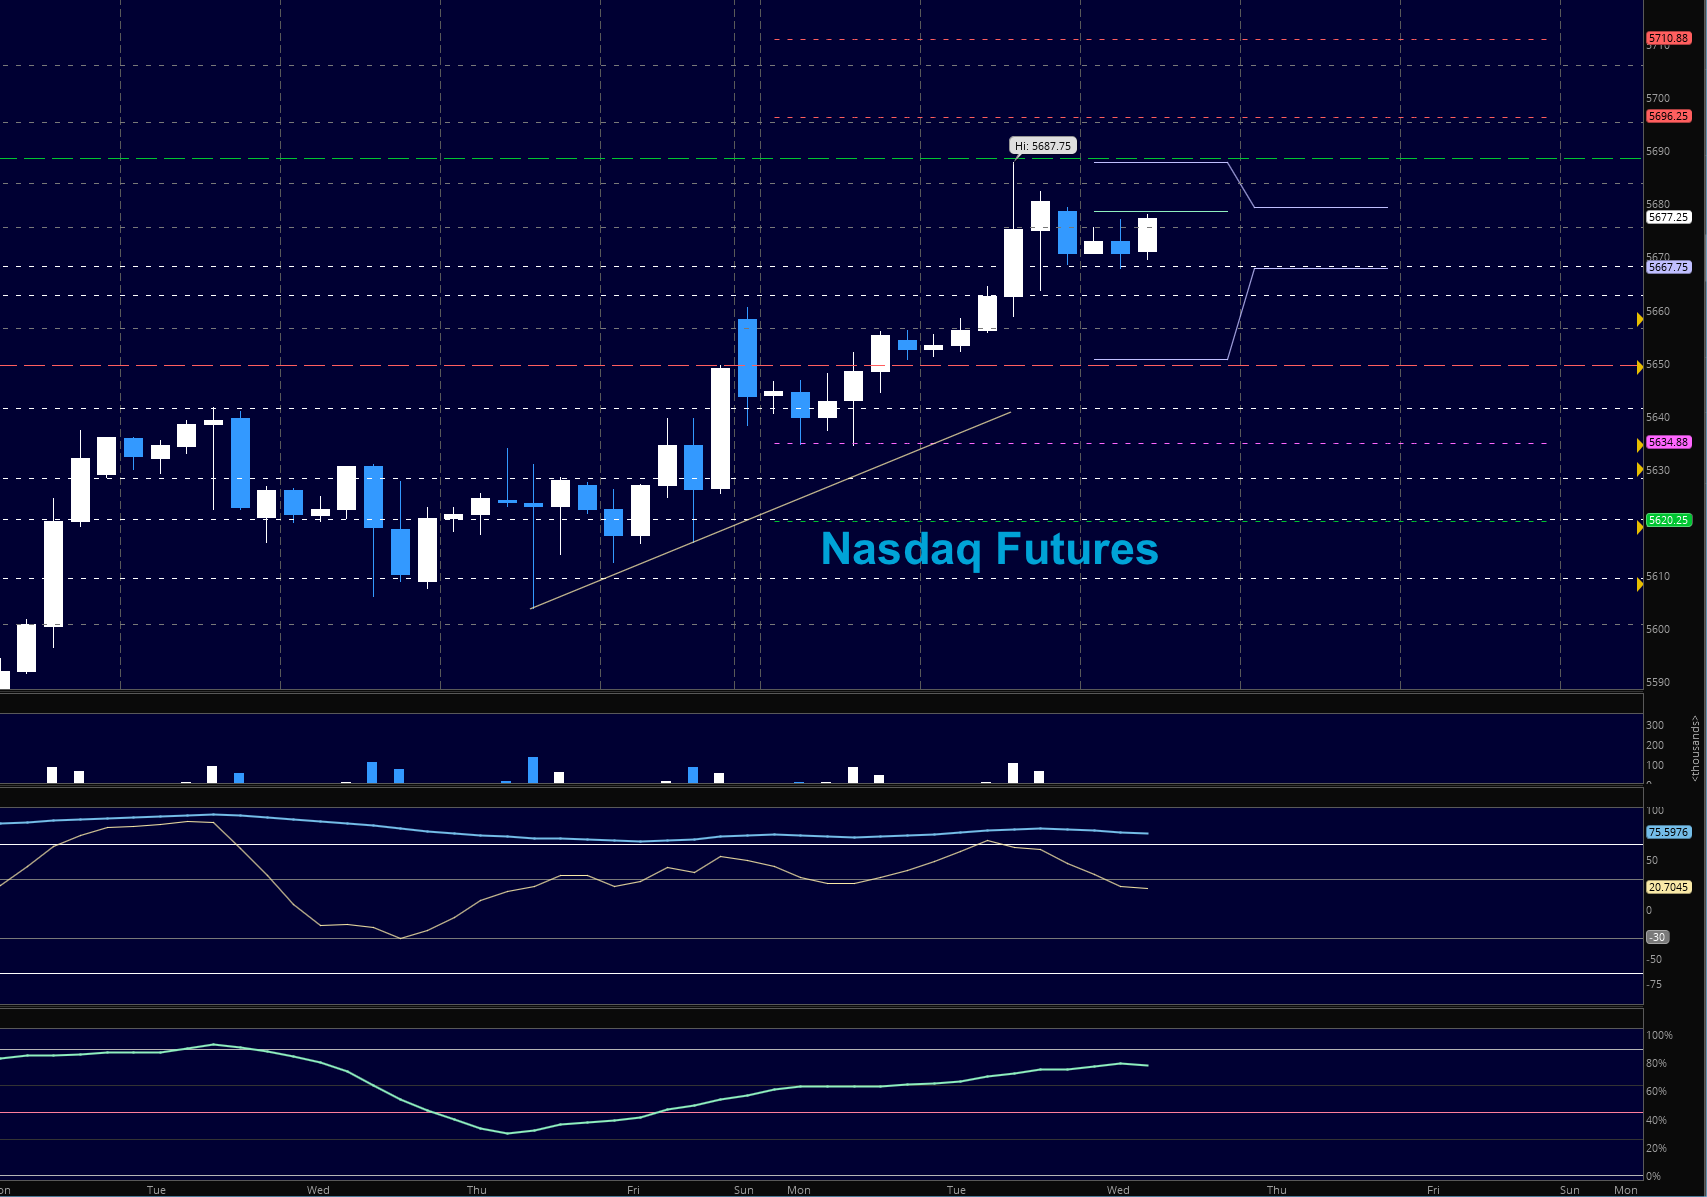
NASDAQ Futures (NQ)
As this chart retreats from the highs, value areas of support continue to be best for entries long. We had a big expansion that we should sit within the range of today. The bullets below represent the likely shift of trading momentum at the positive or failed tests at the levels noted.
- Buying pressure intraday will likely strengthen with a positive retest of 5680.5
- Selling pressure intraday will likely strengthen with a failed retest of 5667
- Resistance sits near 5679.5 to 5685.25, with 5687.5 and 5695.25 above that
- Support holds between 5662.75 and 5658.25, with 5649.75 and 5641.5 below that
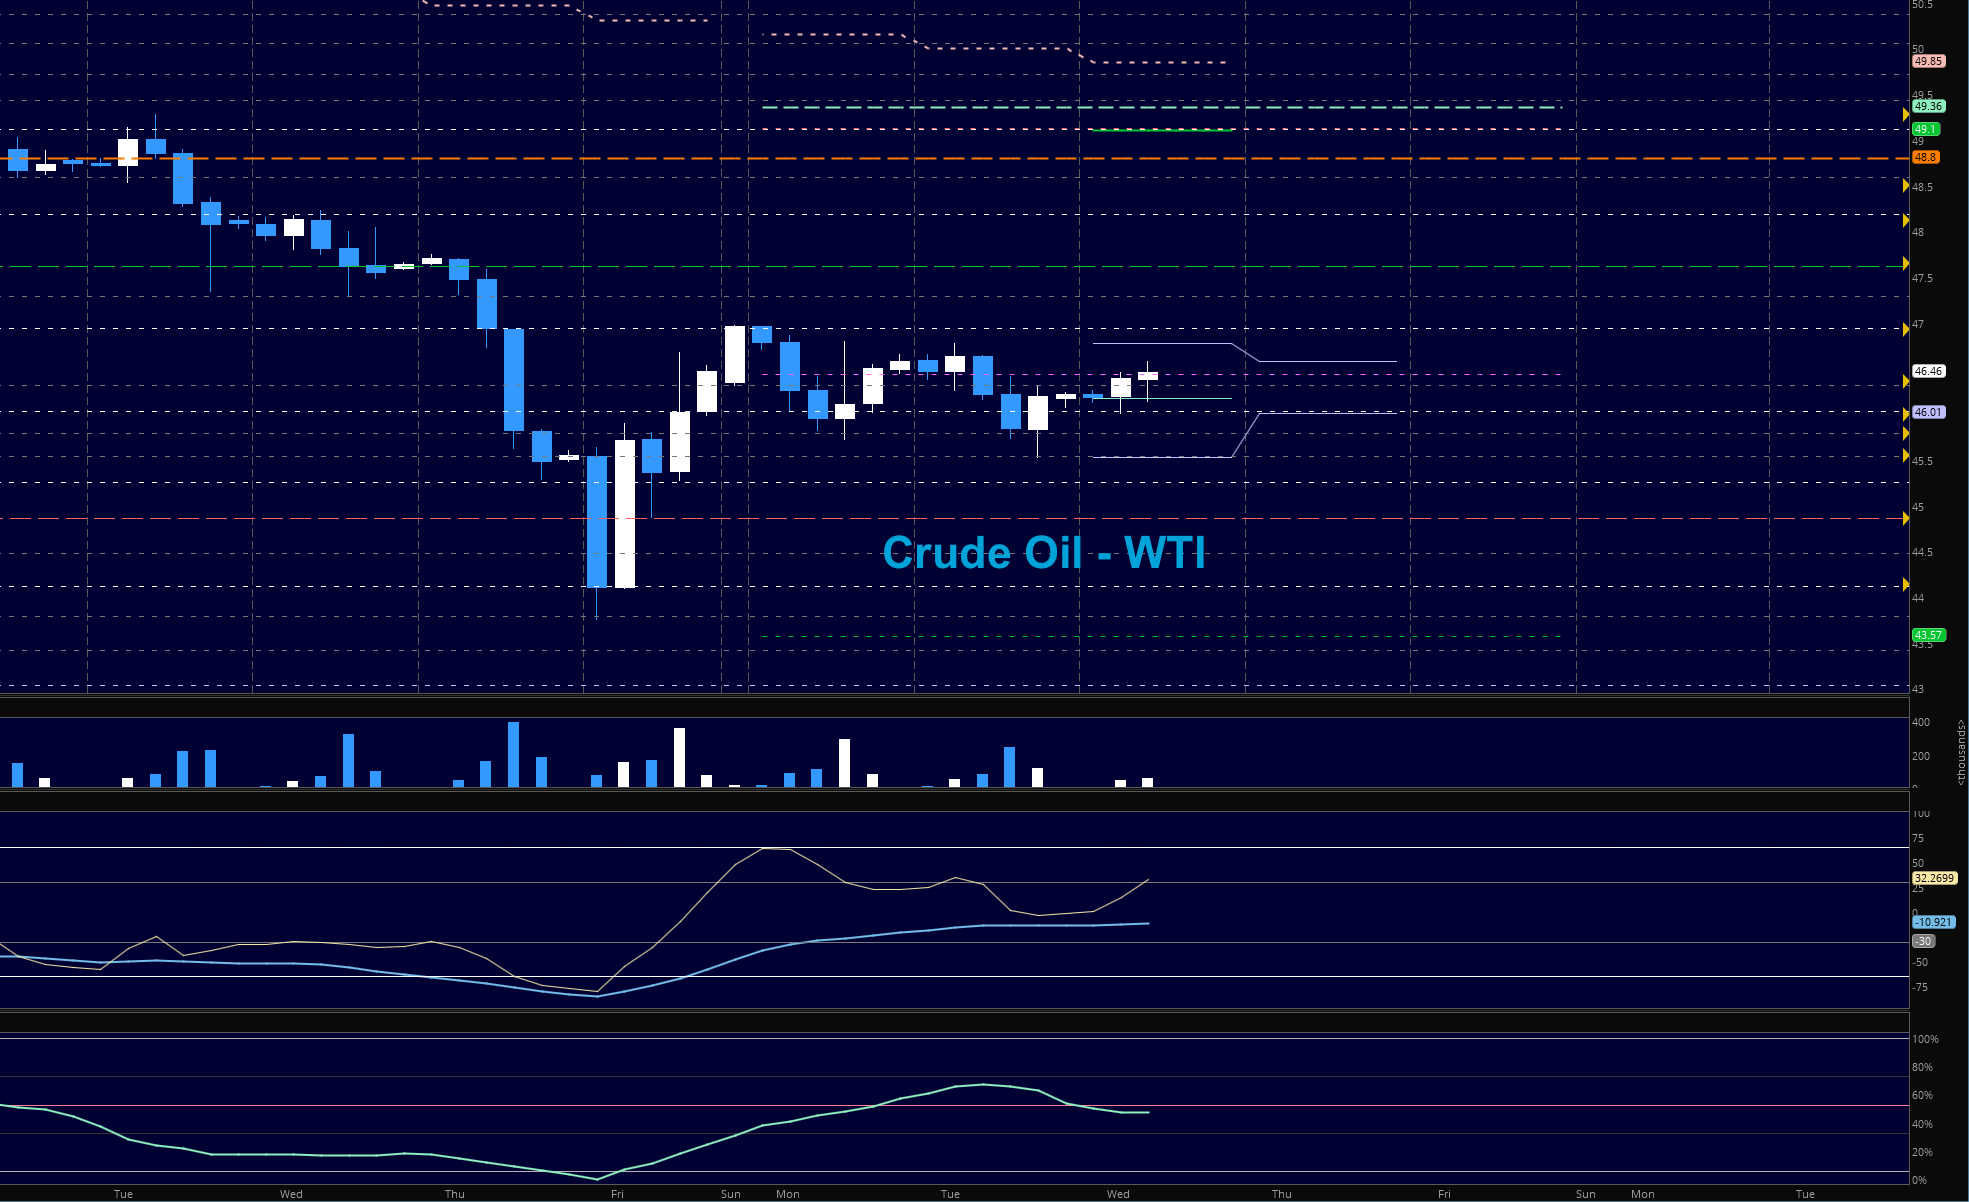
Crude Oil –WTI
OPEC struggles to regain the narrative of higher prices as buyers prop us up with higher lows into the API meeting after the close today. We are tightening ranges with both lower highs and higher lows. I suspect if we breach and hold 46.96, we will likely squeeze up into the initial breakdown of near 47.3 to 47.6, but the attempt to break 46.78 has failed so far. The bullets below represent the likely shift of trading momentum at the positive or failed tests at the levels noted.
- Buying pressure intraday will likely strengthen with a positive retest of 46.96
- Selling pressure intraday will strengthen with a failed retest of 46.01
- Resistance sits near 46.65 to 46.96, with 47.3 and 47.64 above that.
- Support holds between 46.01 and 45.8, with 45.49 and 45.27 below that.
Our live trading room is now primarily stock market futures content, though we do track heavily traded stocks and their likely daily trajectories as well – we begin at 9am with a morning report and likely chart movements along with trade setups for the day.
As long as the trader keeps himself aware of support and resistance levels, risk can be very adequately managed to play in either direction as bottom picking remains a behavior pattern that is developing with value buyers and speculative traders.
Twitter: @AnneMarieTrades
The author trades stock market futures every day and may have a position in mentioned securities at the time of publication. Any opinions expressed herein are solely those of the author, and do not in any way represent the views or opinions of any other person or entity.


 Ready To Break Out?")


 Rolling Over At Key Fibonacci Level?")
