Stock Market Futures Trading Considerations For November 3, 2017
The S&P 500 (INDEXSP:.INX) and Nasdaq (INDEXNASDAQ:.IXIC) are modestly higher on Friday morning as the market tries to make another push higher. Key trading levels and futures market commentary can be found below.
Check out today’s economic calendar with a full rundown of releases. And note that the charts below are from our premium service and shared exclusively with See It Market readers.
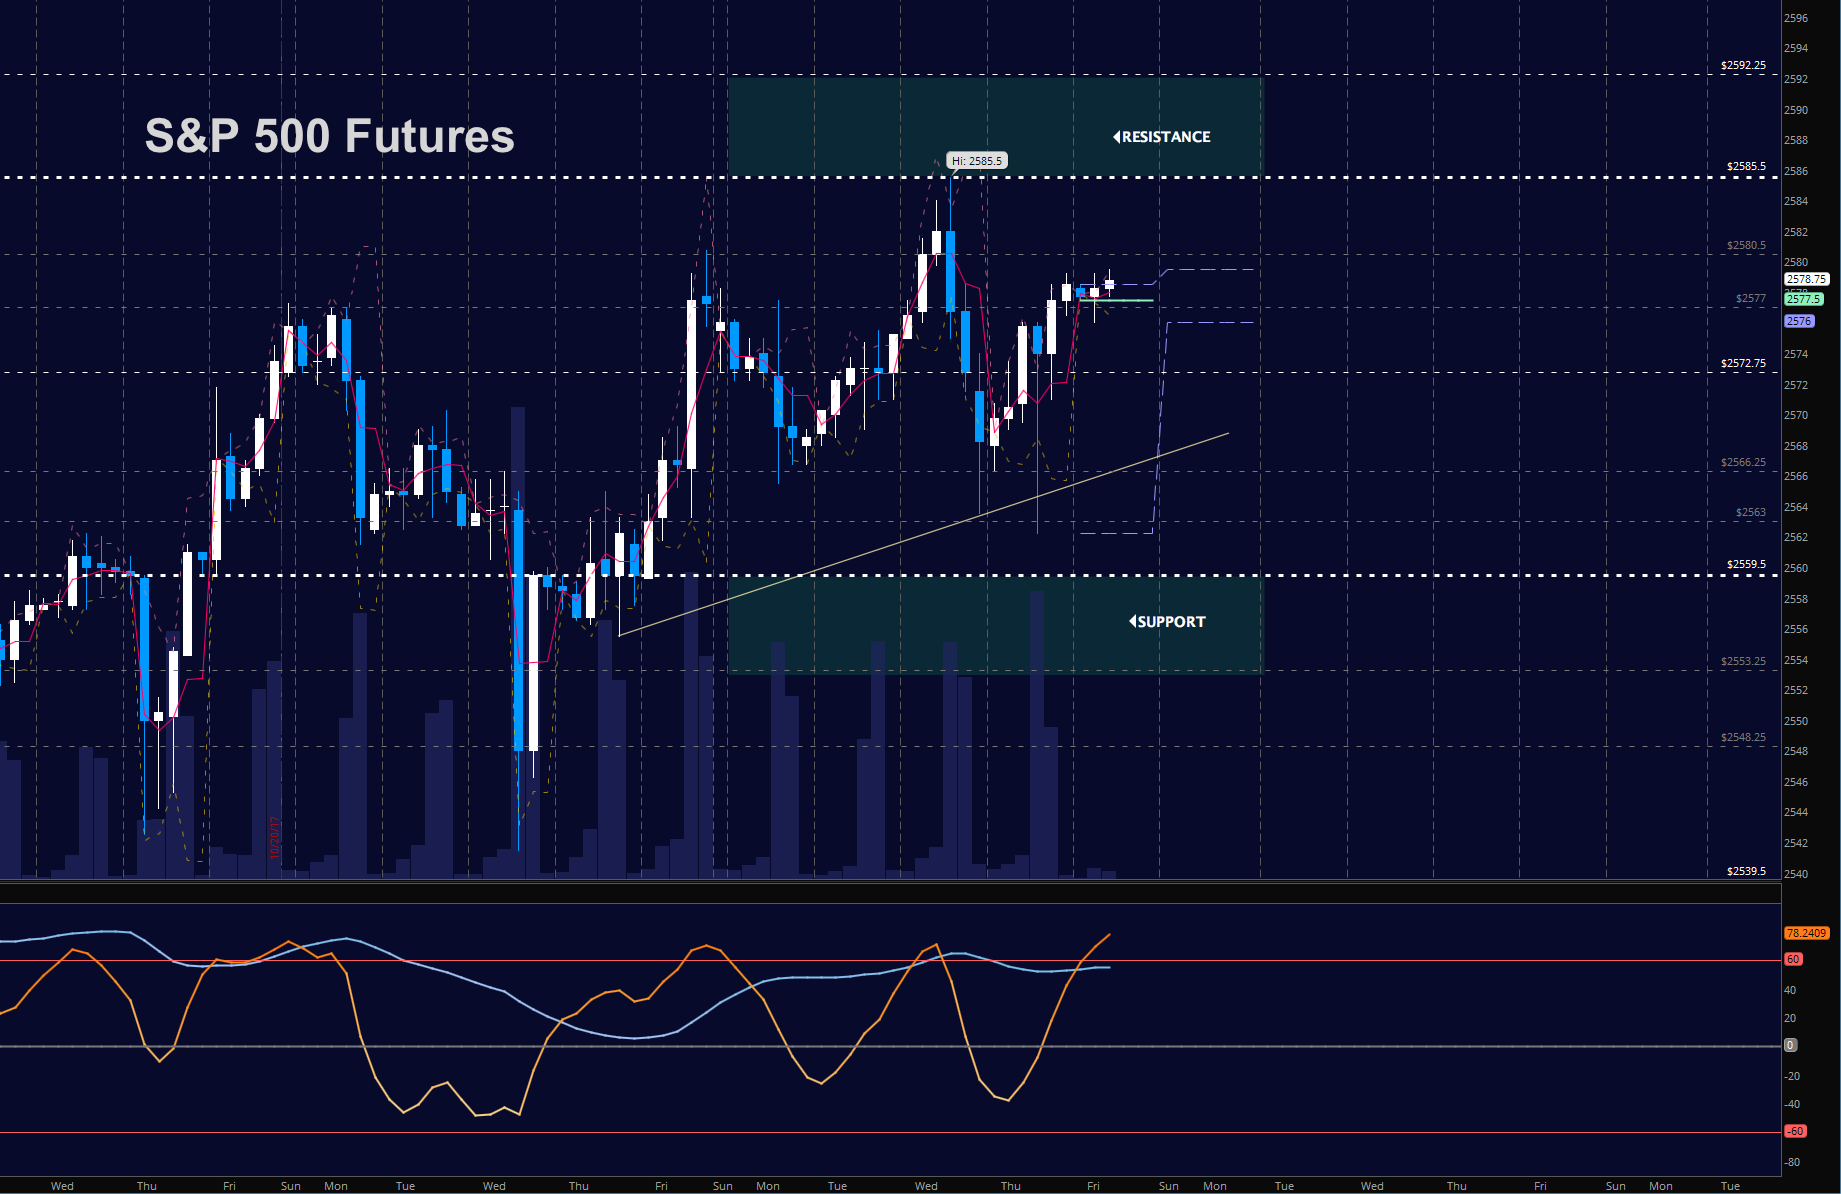
S&P 500 Futures
The TEST OF SUPPORT held and HIGHER LOWS resumed. We sit near resistance at a LOWER HIGH near 2578.5. Above this region, we will resume upside momentum. Ahead is NON_FARM PAYROLL before the open and traders seem poised to participate in the break above once more. Watch support regions to hold in the climb forward. The bullets below represent the likely shift of trading momentum at the positive or failed retests at the levels noted.
- Buying pressure intraday will likely strengthen above a positive retest of 2578.5
- Selling pressure intraday will likely strengthen with a failed retest of 2568.5
- Resistance sits near 2578.75 to 2582.5, with 2585.75 and 2588.5 above that.
- Support holds between 2566.5 and 2563.5, with 2560.5 and 2557.5 below that.
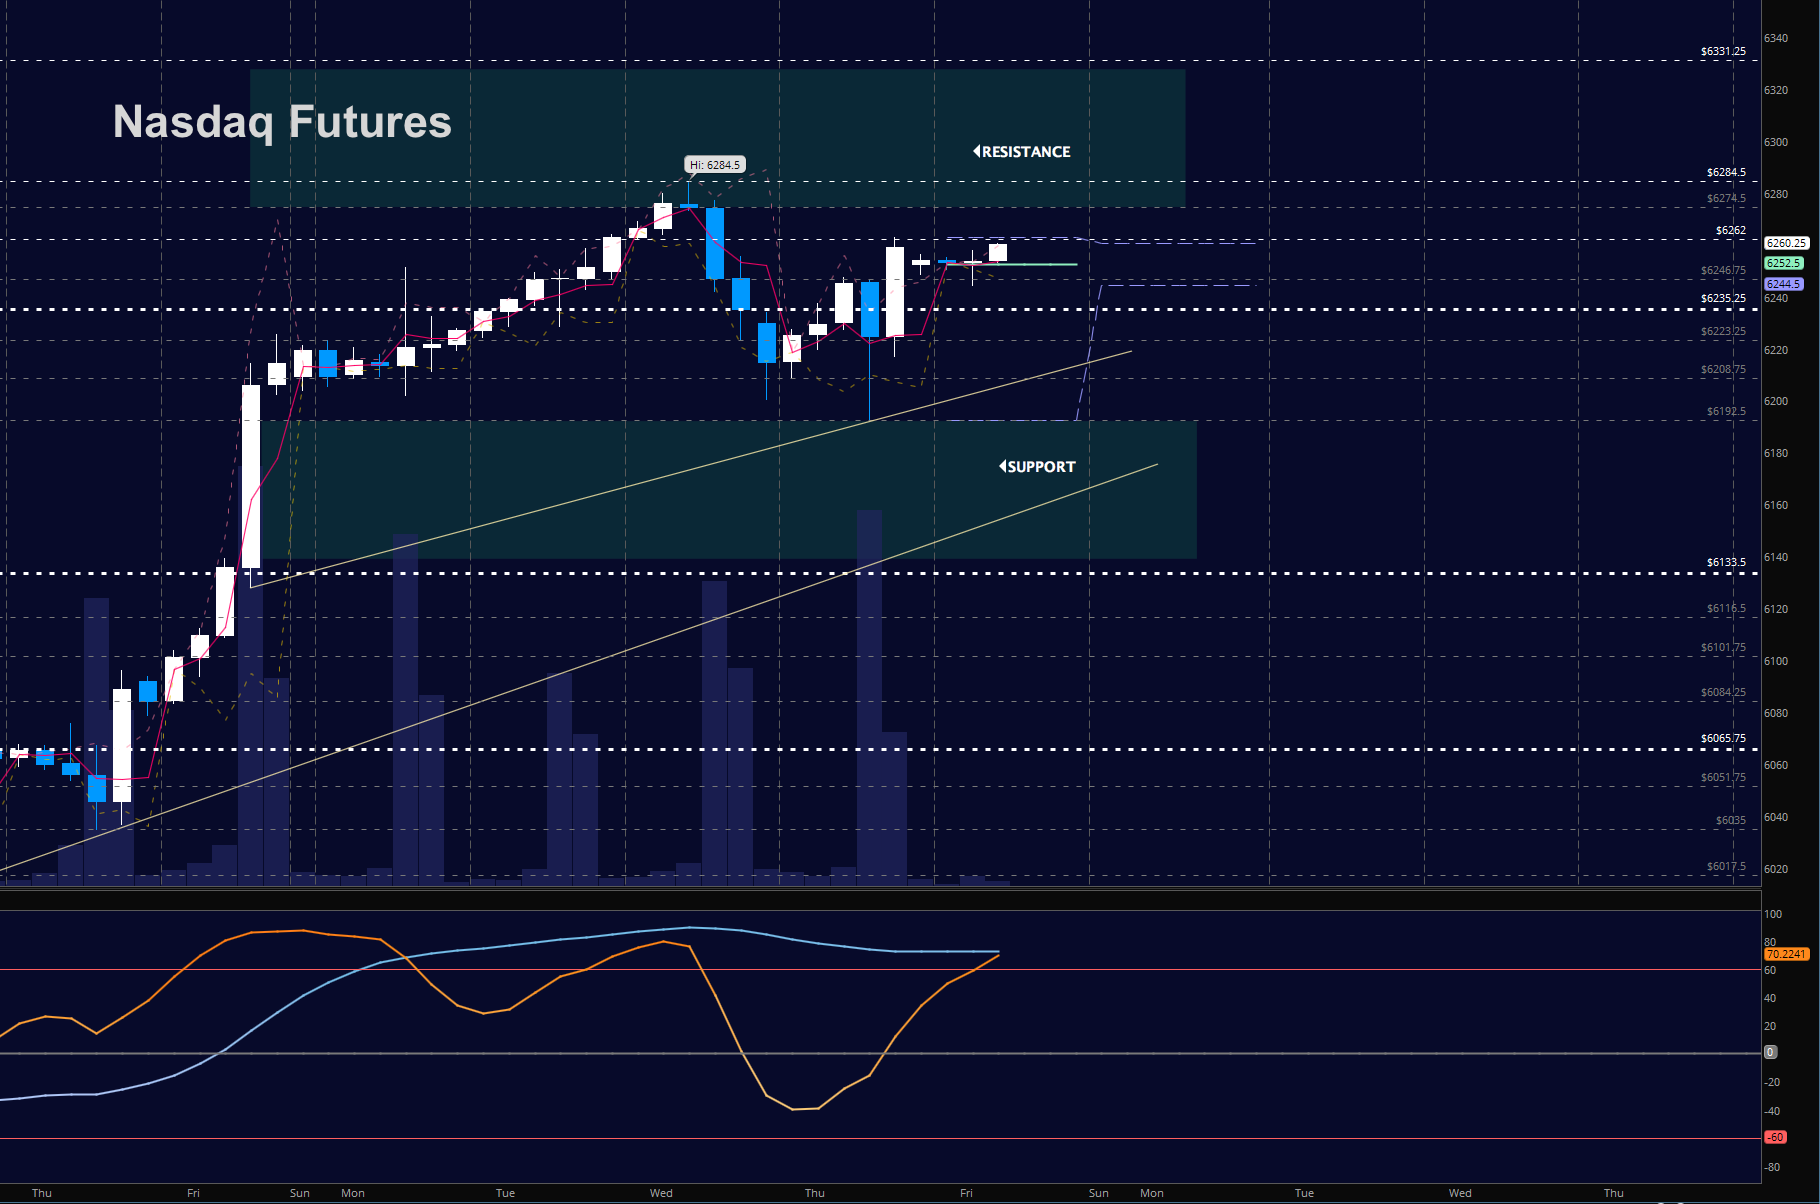
NASDAQ Futures
The NQ bounce on AAPL reports onto resistance near 6262.75. This is a LOWER HIGH while holding HIGHER LOWS. As long as we hold 6236.75, buyers will hold strength. The bullets below represent the likely shift of intraday trading momentum at the positive or failed tests at the levels noted.
- Buying pressure intraday will likely strengthen with a positive retest of 6262.75
- Selling pressure intraday will likely strengthen with a failed retest of 6223.5
- Resistance sits near 6262.75 to 6274.75 with 6284.75 and 6299.5 above that.
- Support holds between 6209.25 and 6200.5, with 6194.75 and 6181.5 below that.
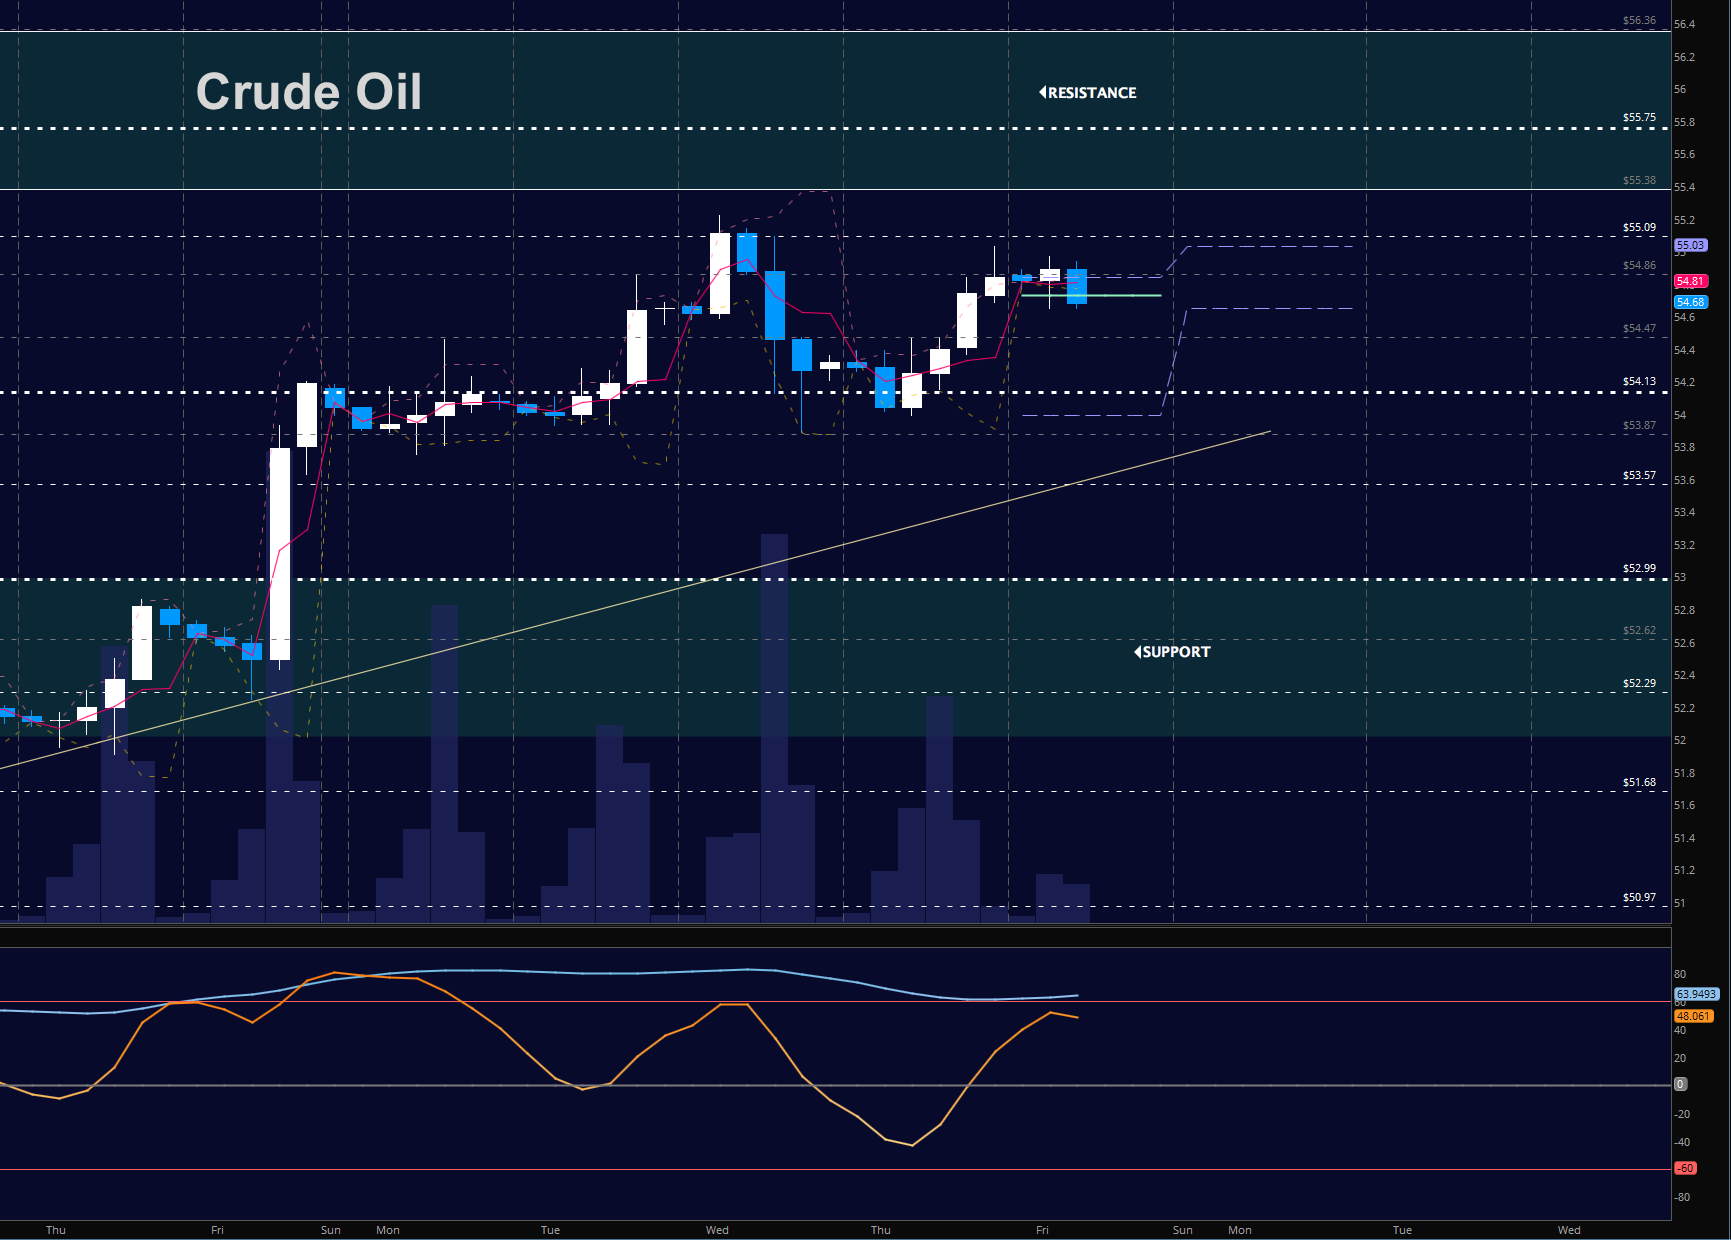
WTI Crude Oil
Oil faded off its Wednesday earning morning high with a drift back to the breakout levels near 54. Momentum is bullish and we are essentially range bound as the clear line of defense holds above 54. Resistance sits near 55.14. The bullets below represent the likely shift of trading momentum at the positive or failed tests at the levels noted.
- Buying pressure intraday will likely strengthen with a positive retest of 55.15
- Selling pressure intraday will strengthen with a failed retest of 53.9
- Resistance sits near 55.04 to 55.22, with 55.48 and 55.88 above that.
- Support holds between 54.47 to 54.02, with 53.76 and 53.27 below that.
If you’re interested in the live trading room, it is now primarily stock market futures content, though we do track heavily traded stocks and their likely daily trajectories as well – we begin at 9am with a morning report and likely chart movements along with trade setups for the day.
As long as the trader keeps himself aware of support and resistance levels, risk can be very adequately managed to play in either direction as bottom picking remains a behavior pattern that is developing with value buyers and speculative traders.
Twitter: @AnneMarieTrades
The author trades stock market futures every day and may have a position in mentioned securities at the time of publication. Any opinions expressed herein are solely those of the author, and do not in any way represent the views or opinions of any other person or entity.


")


