Stock Market Futures Considerations For June 15, 2017
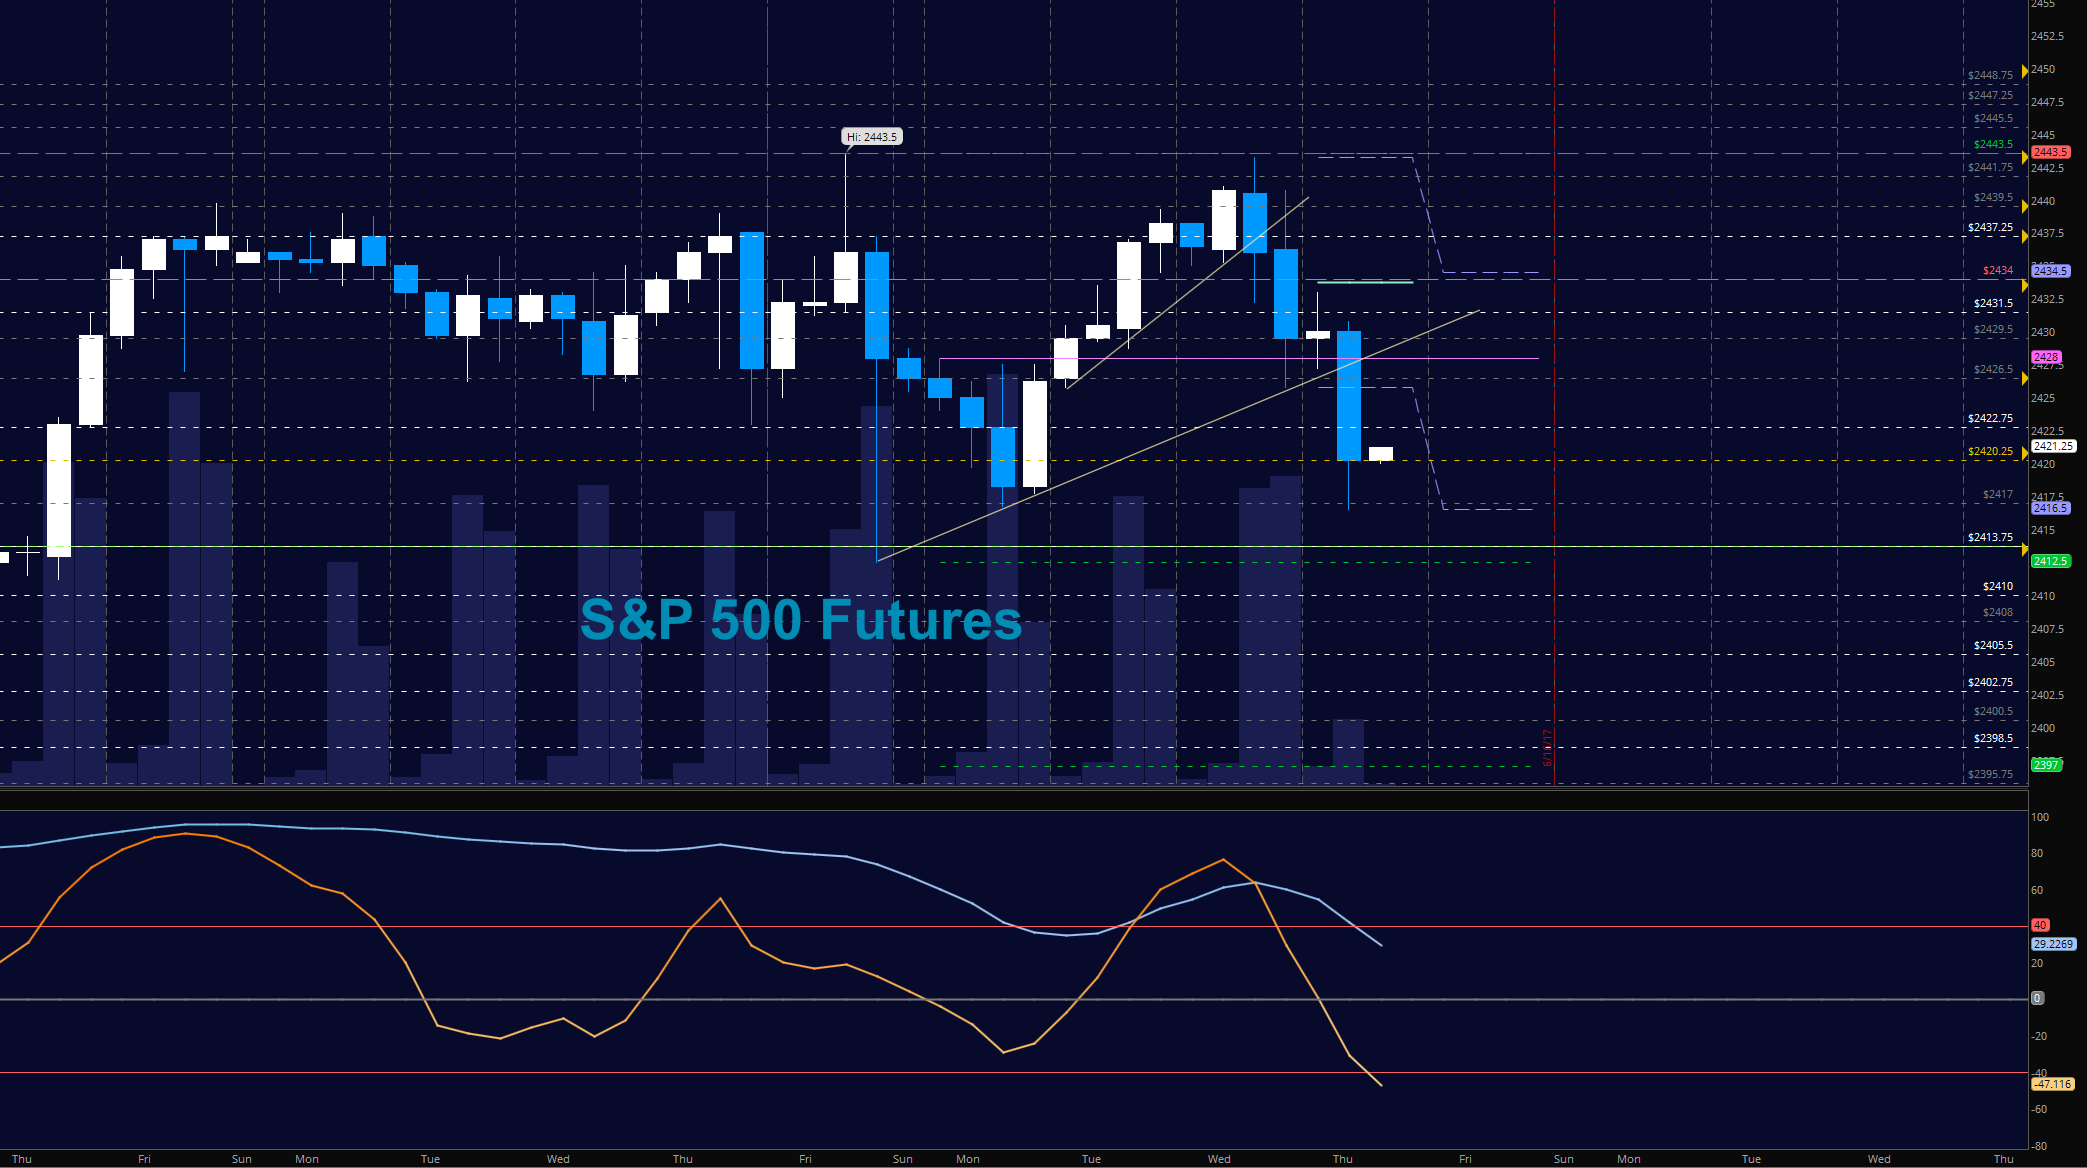
The overnight fade leads us deep into support on the S&P 500 (INDEXSP:.INX). That support on the futures comes in at 2420. Check out today’s key trading levels below.
Note that the charts below are from our premium service at The Trading Book and are shared exclusively with See It Market readers. For complete setups each day, consider the GOLD level membership at TheTradingBook.com.
S&P 500 Futures (ES)
If we see the loss of 2416 will be important to be recaptured else we will very likely test 2402.75. Breakouts seem likely with a run of stops ahead, and a fade to higher lows. The bullets below represent the likely shift of trading momentum at the positive or failed retests at the levels noted.
- Buying pressure intraday will likely strengthen above a positive retest of 2429.5
- Selling pressure intraday will likely strengthen with a failed retest of 2420
- Resistance sits near 2431.5 to 2434, with 2443.75 and 2449.5 above that.
- Support holds between 2420.5 and 2417, with 2412.5 and 2402.75 below that.
E-mini S&P Futures (trade setups)
Upside trades –
- Positive retest of continuation level -2423.5
- Positive retest of support level– 2417.5
- Opening targets ranges- 2425.75, 2428, 2431.25, 2434, 2437.25, 2439.5, 2441.75, 2443.5, 2445.5, 2447.75, 2449.25, 2453.75, 2459
Downside trades –
- Failed retest of resistance level -2425
- Failed retest of support level– 2419
- Opening target ranges– 2417.5, 2413.25, 2410, 2408.25, 2406.25, 2402.75, 2400.75, 2398.75, 2395.5, 2391.75, 2388.75, 2386.75, 2381.25, 2378.75, 2375.25, 2370.75, 2365.75, 2361.25
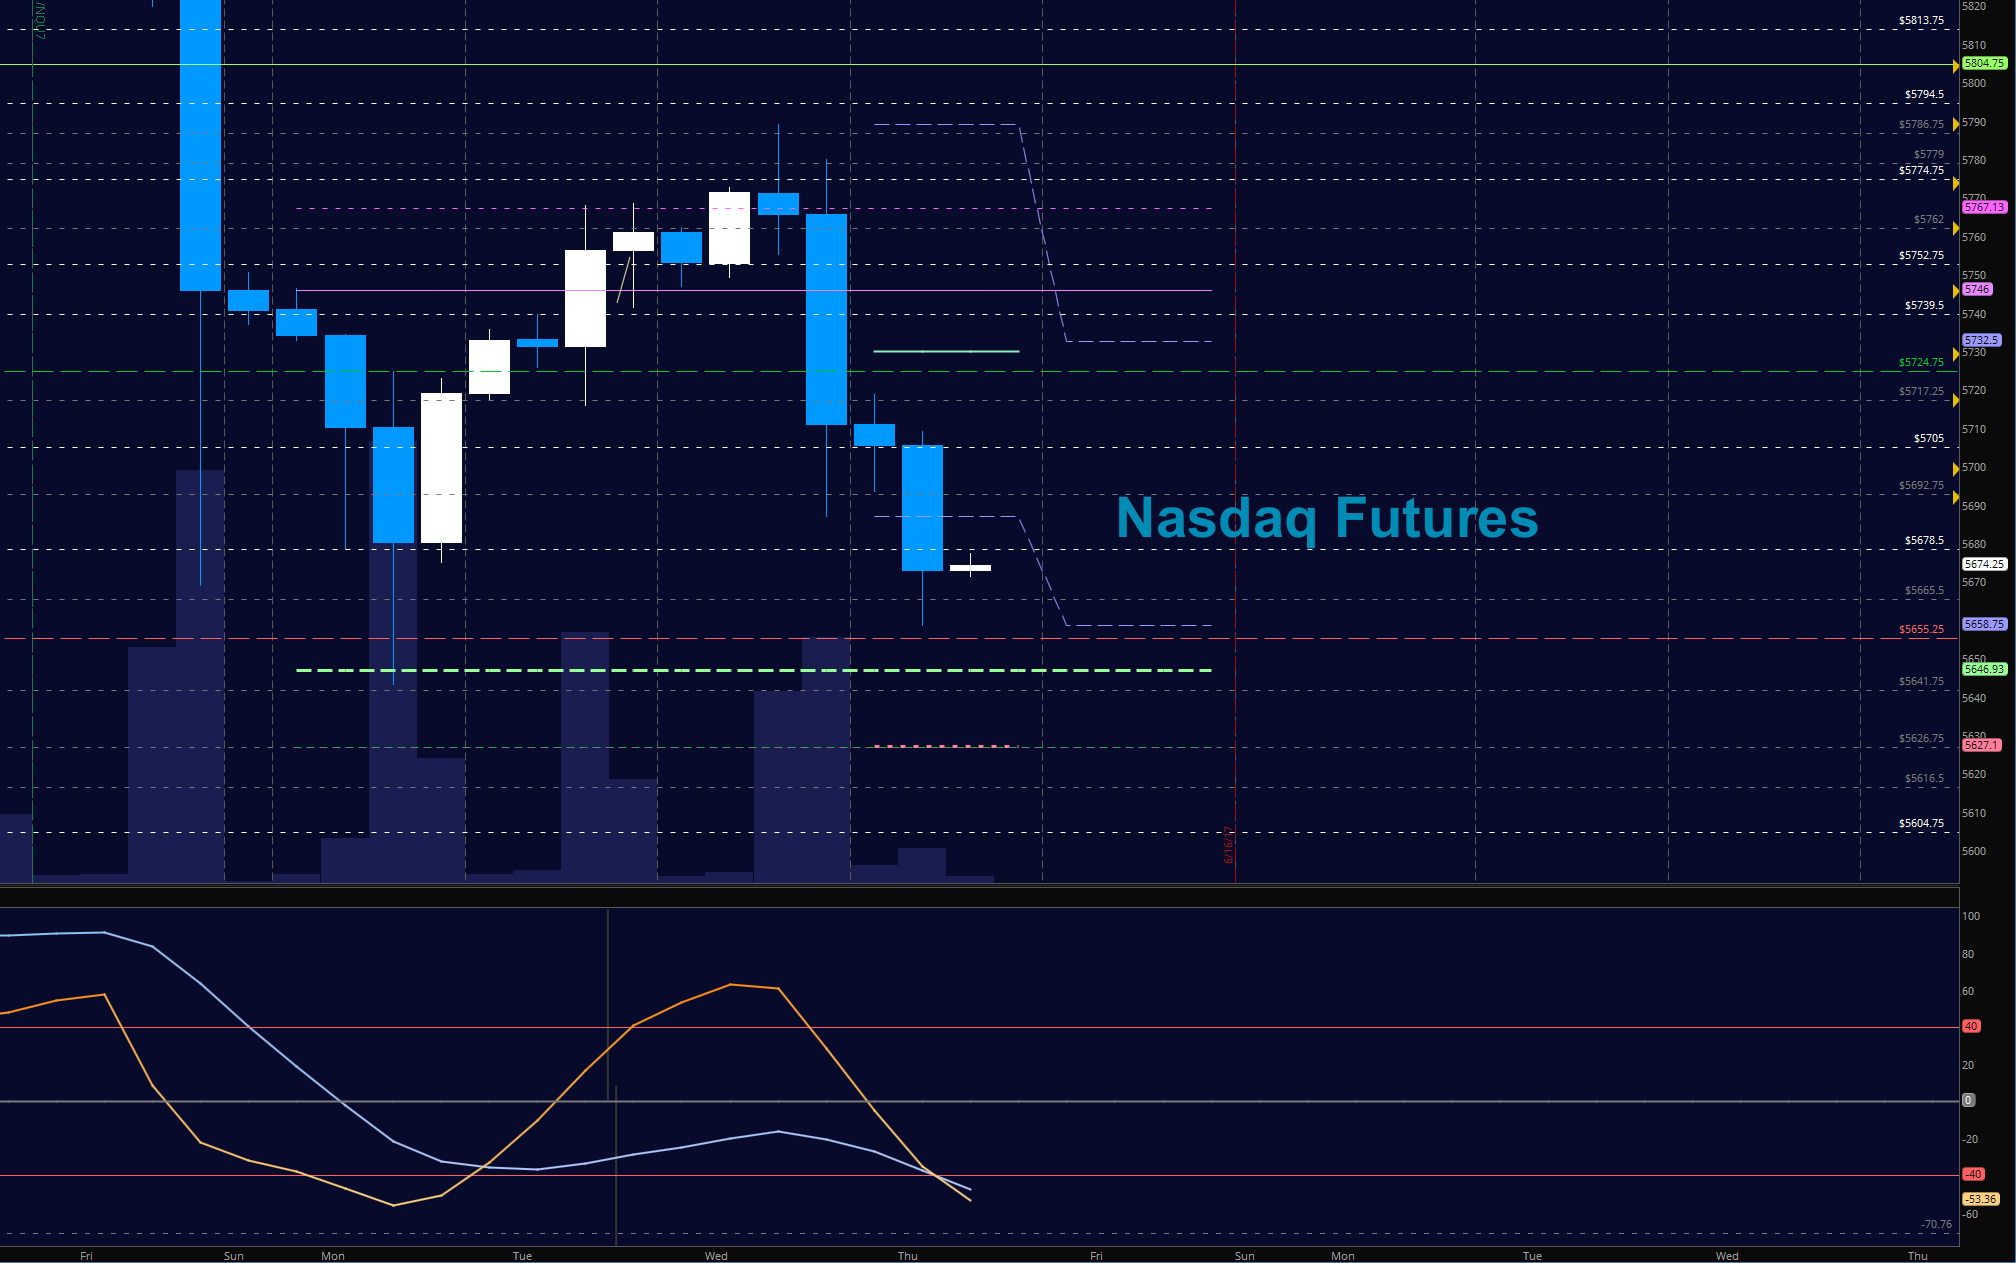
NASDAQ Futures (NQ)
The NQ_F has returned to near lows from three days ago. The bounce to lower highs near 5786.75 was met with fierce selling that has not abated just yet on the Nasdaq (INDEXNASDAQ:.IXIC). Price support near 5649 is big weekly support on composite charts was tested and held days ago, and may be tested again. Buyers are now setting up near 5674. Sellers are still in charge, however. Key resistance now sits between 5690 and 5727. The bullets below represent the likely shift of intraday trading momentum at the positive or failed tests at the levels noted.
- Buying pressure intraday will likely strengthen with a positive retest of 5727
- Selling pressure intraday will likely strengthen with a failed retest of 5665.5
- Resistance sits near 5694 to 5724.5, with 5739.75 and 5762.5 above that.
- Support holds between 5670.25 and 5665.75, with 5647 and 5627 below that.
NQ NASDAQ Futures (trade setups)
Upside trades –
- Positive retest of continuation level -5690.5
- Positive retest of support level– 5678.5
- Opening target ranges – 5682.25, 5690.25, 5697.5, 5704.75, 5711.25, 5717.25, 5724.75, 5732.5, 5739.75, 5746, 5752.75, 5762.25, 5769.5, 5772.25, 5778.5, 5787.5, , 5794.5, 5804.75, 5813.75, 5824.5, 5844
Downside trades-
- Failed retest of resistance level -5686.5
- Failed retest of support level– 5678.5
- Opening target ranges –5724.5, 5720.5, 5717.25, 5710.75, 5706.75, 5700.25, 5692.75, 5686.5, 5678.5, 5674.5, 5670.75, 5665.5, 5659.5, 5655.25, 5647.5, 5641.5, 5626.75, 5616.5
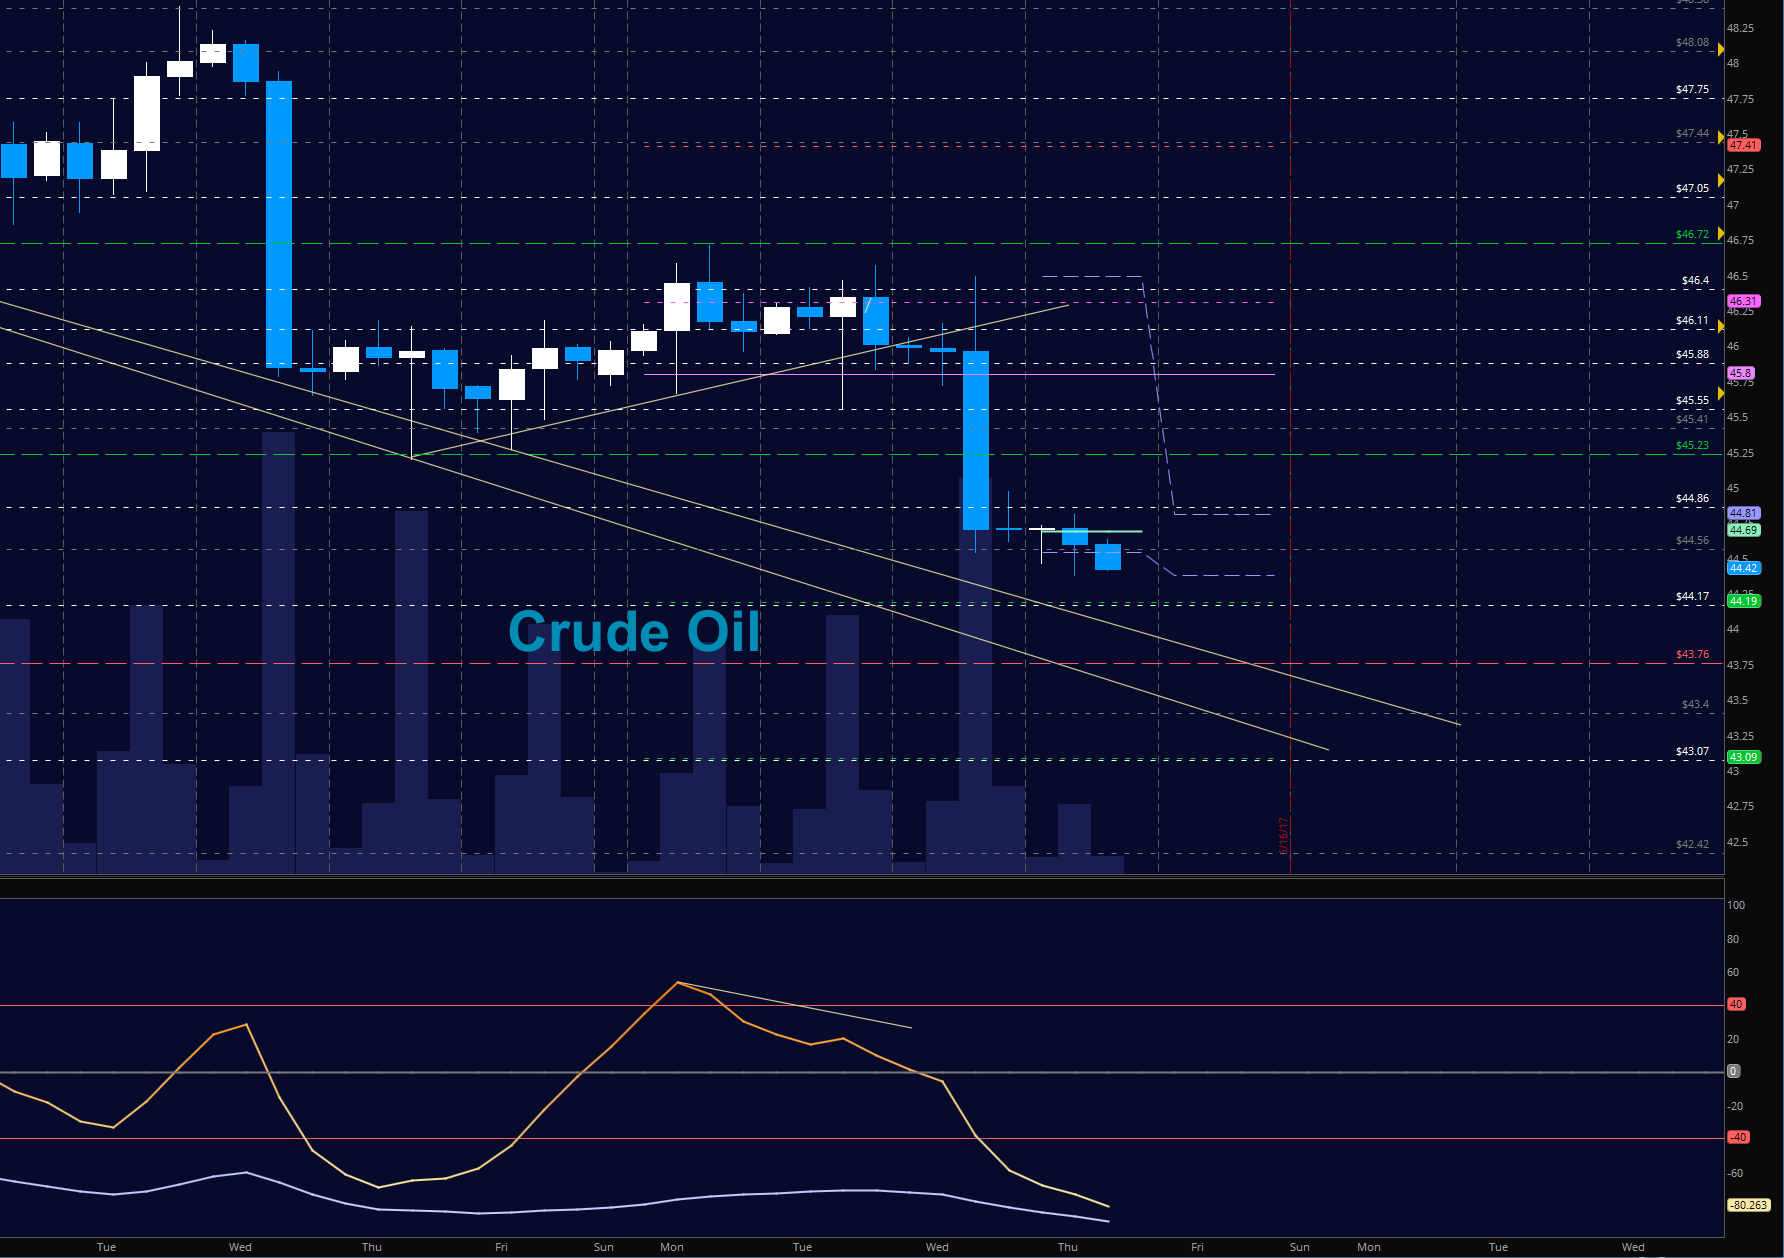
WTI Crude Oil
Selling is in full force under the news of glut. A Fibonacci formation projects a fade into 41 or so. Buyers are likely to try to stage a move near 44.17 and then again at 43.76 if we do not quickly recover 44.86, which stands as resistance. The bullets below represent the likely shift of trading momentum at the positive or failed tests at the levels noted.
- Buying pressure intraday will likely strengthen with a positive retest of 44.94
- Selling pressure intraday will strengthen with a failed retest of 44.3
- Resistance sits near 45.23 to 45.57, with 46.11 and 46.4 above that.
- Support holds between 44.3 to 44.17, with 43.76 and 43.07 below that.
Crude Oil (trade setups)
Upside trades –
- Positive retest of continuation level -44.94
- Positive retest of support level– 44.56
- Opening target ranges– 44.69, 44.86, 45.23, 45.41, 45.55, 45.78, 45.98, 46.23, 46.4, 46.56, 46.72, 46.94, 47.18, 47.4, 47.68, 47.9, 48.11, 48.38, 48.63, 48.89, 49.05, 49.4
Downside trades-
- Failed retest of resistance level -44.8
- Failed retest of support level– 44.3
- Opening target ranges– 44.6, 44.47, 44.34, 44.19, 44.04, 43.76, 43.54, 43.12
If you’re interested in watching these trades go live, join us in the live trading room from 9am to 11:30am each trading day. Visit TheTradingBook for more information.
Our live trading room is now primarily stock market futures content, though we do track heavily traded stocks and their likely daily trajectories as well – we begin at 9am with a morning report and likely chart movements along with trade setups for the day.
As long as the trader keeps himself aware of support and resistance levels, risk can be very adequately managed to play in either direction as bottom picking remains a behavior pattern that is developing with value buyers and speculative traders.
Twitter: @AnneMarieTrades
The author trades stock market futures every day and may have a position in mentioned securities at the time of publication. Any opinions expressed herein are solely those of the author, and do not in any way represent the views or opinions of any other person or entity.


 Ready To Break Out?")


")
