Stock Market Futures Considerations For July 5, 2017
Market futures traded in tight ranges with low volume yesterday as the US observed the Independence holiday. This morning opens trading with markets little changed. See key levels for the S&P 500 (INDEXSP:.INX) and more below.
Check out today’s economic calendar with a full rundown of releases. And note that the charts below are from our premium service and shared exclusively with See It Market readers.
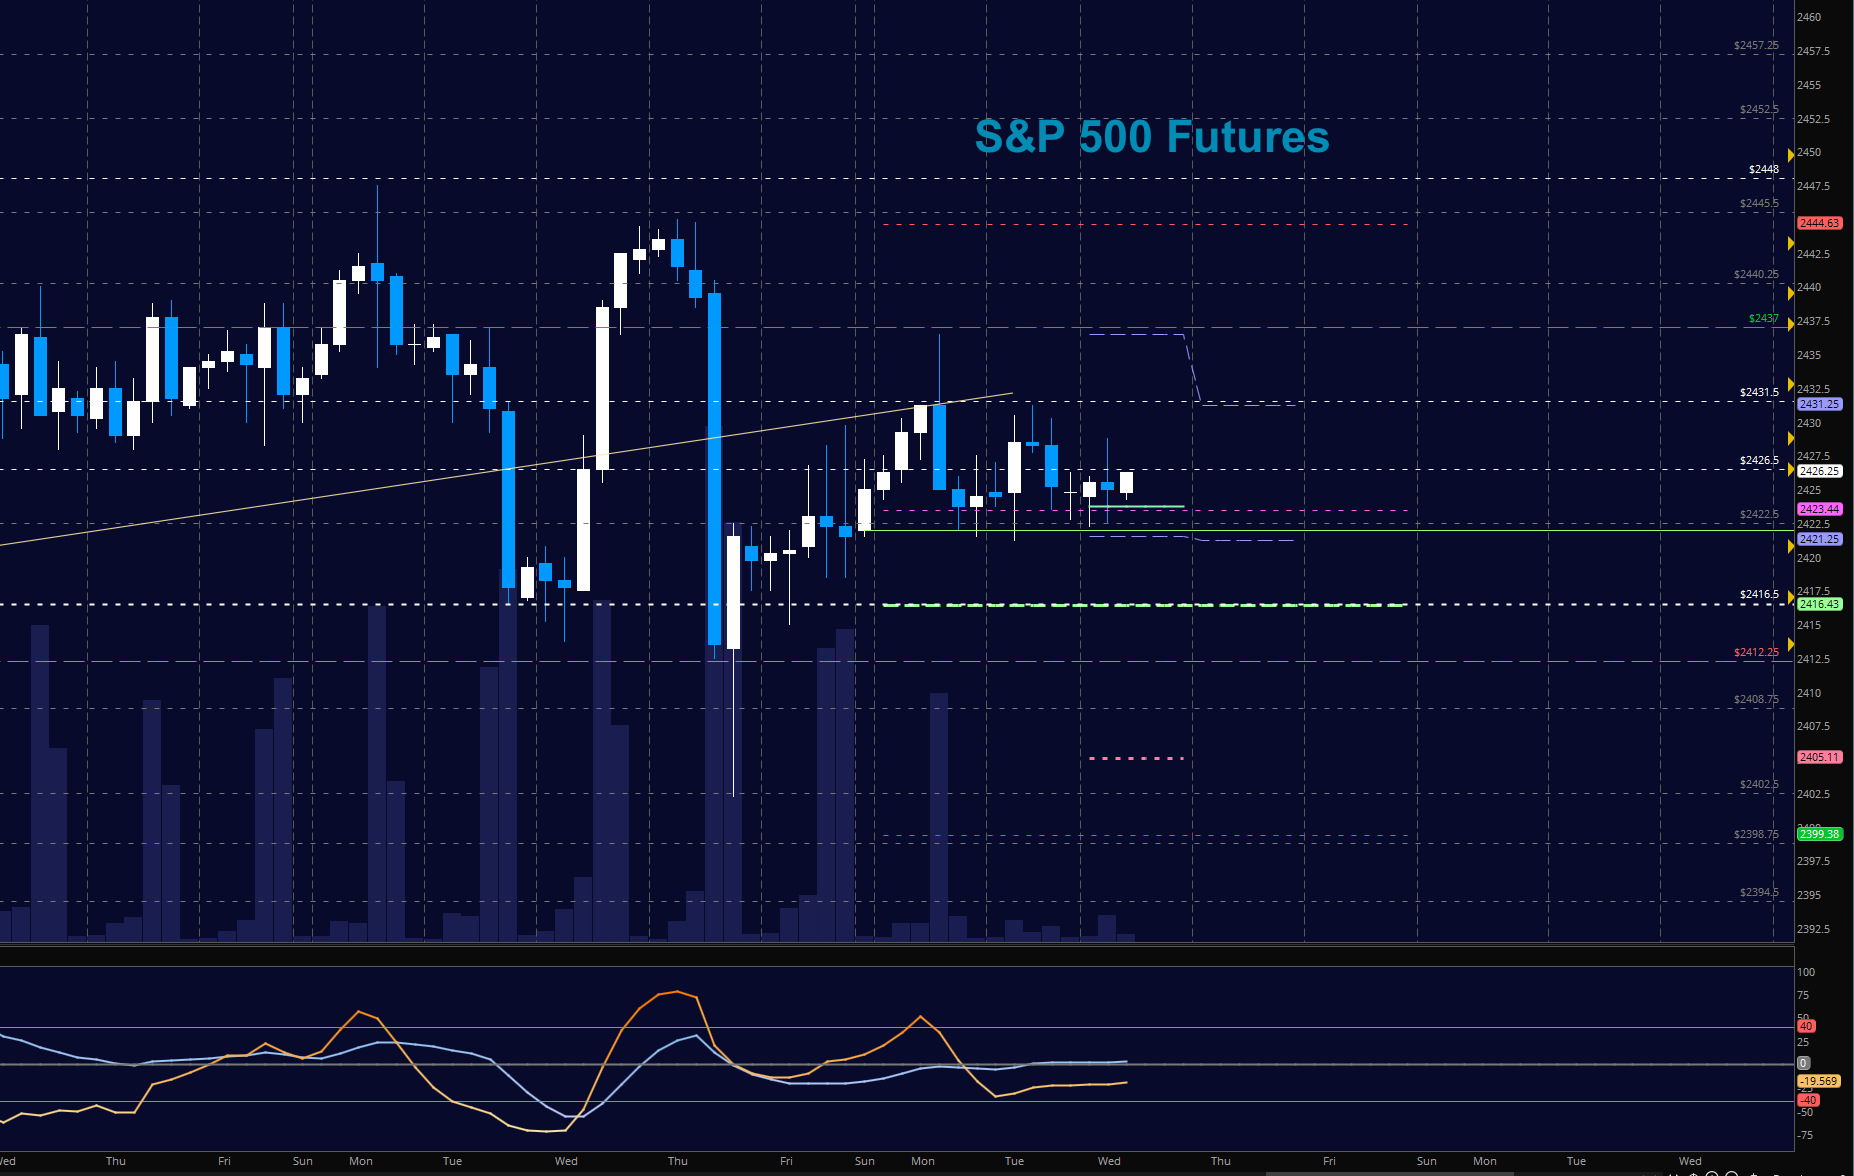
S&P 500 Futures (ES)
Today we are within the tight ranges of yesterday as pressure builds. We are holding near the lower edge of support – 2421. Momentum is mixed across time frames and generally flat. Resistance remains 2437 for now. FOMC minutes are to be released today. NFP is on Friday. Both of these occurrences are likely to keep traders jockeying for position until the release of all data. The bullets below represent the likely shift of trading momentum at the positive or failed retests at the levels noted.
- Buying pressure intraday will likely strengthen above a positive retest of 2431.5 (careful again here with resistance)
- Selling pressure intraday will likely strengthen with a failed retest of 2420
- Resistance sits near 2436.5 to 2439, with 2445.5 and 2448.5 above that.
- Support holds between 2421.5 and 2416.25, with 2412.5 and 2402.5 below that.
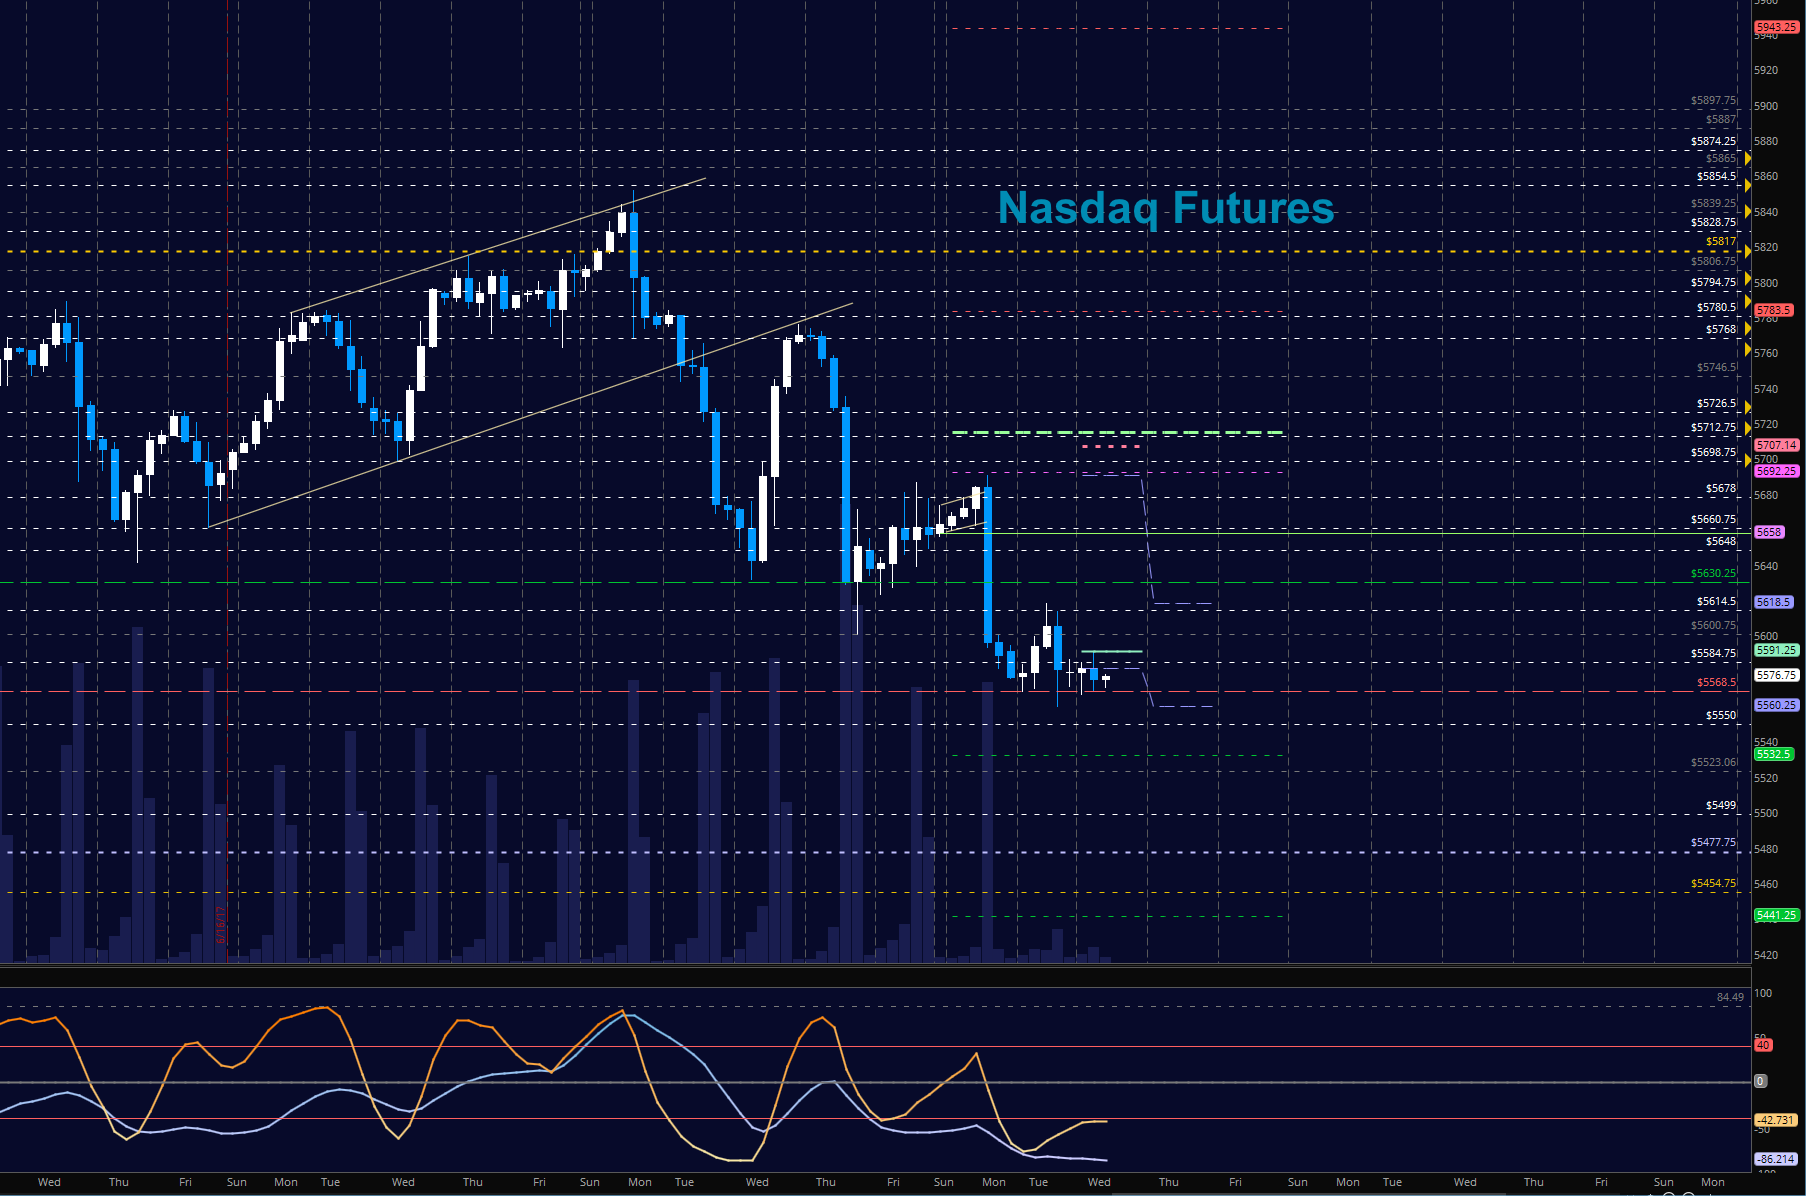
NASDAQ Futures
This one continues to fade. Now we have our eyes on the mark near 5454 – a breakaway event with a gap just above. Bounces are likely to fade at the first pass as momentum is still very negative. Ranges are tightening here but still wider than normal. The bullets below represent the likely shift of intraday trading momentum at the positive or failed tests at the levels noted.
- Buying pressure intraday will likely strengthen with a positive retest of 5600.5
- Selling pressure intraday will likely strengthen with a failed retest of 5565.5
- Resistance sits near 5614.75 to 5648.5, with 5662.25 and 5678.5 above that.
- Support holds between 5568.5 and 5550.75, with 5532.5 and 5477.75 below that.
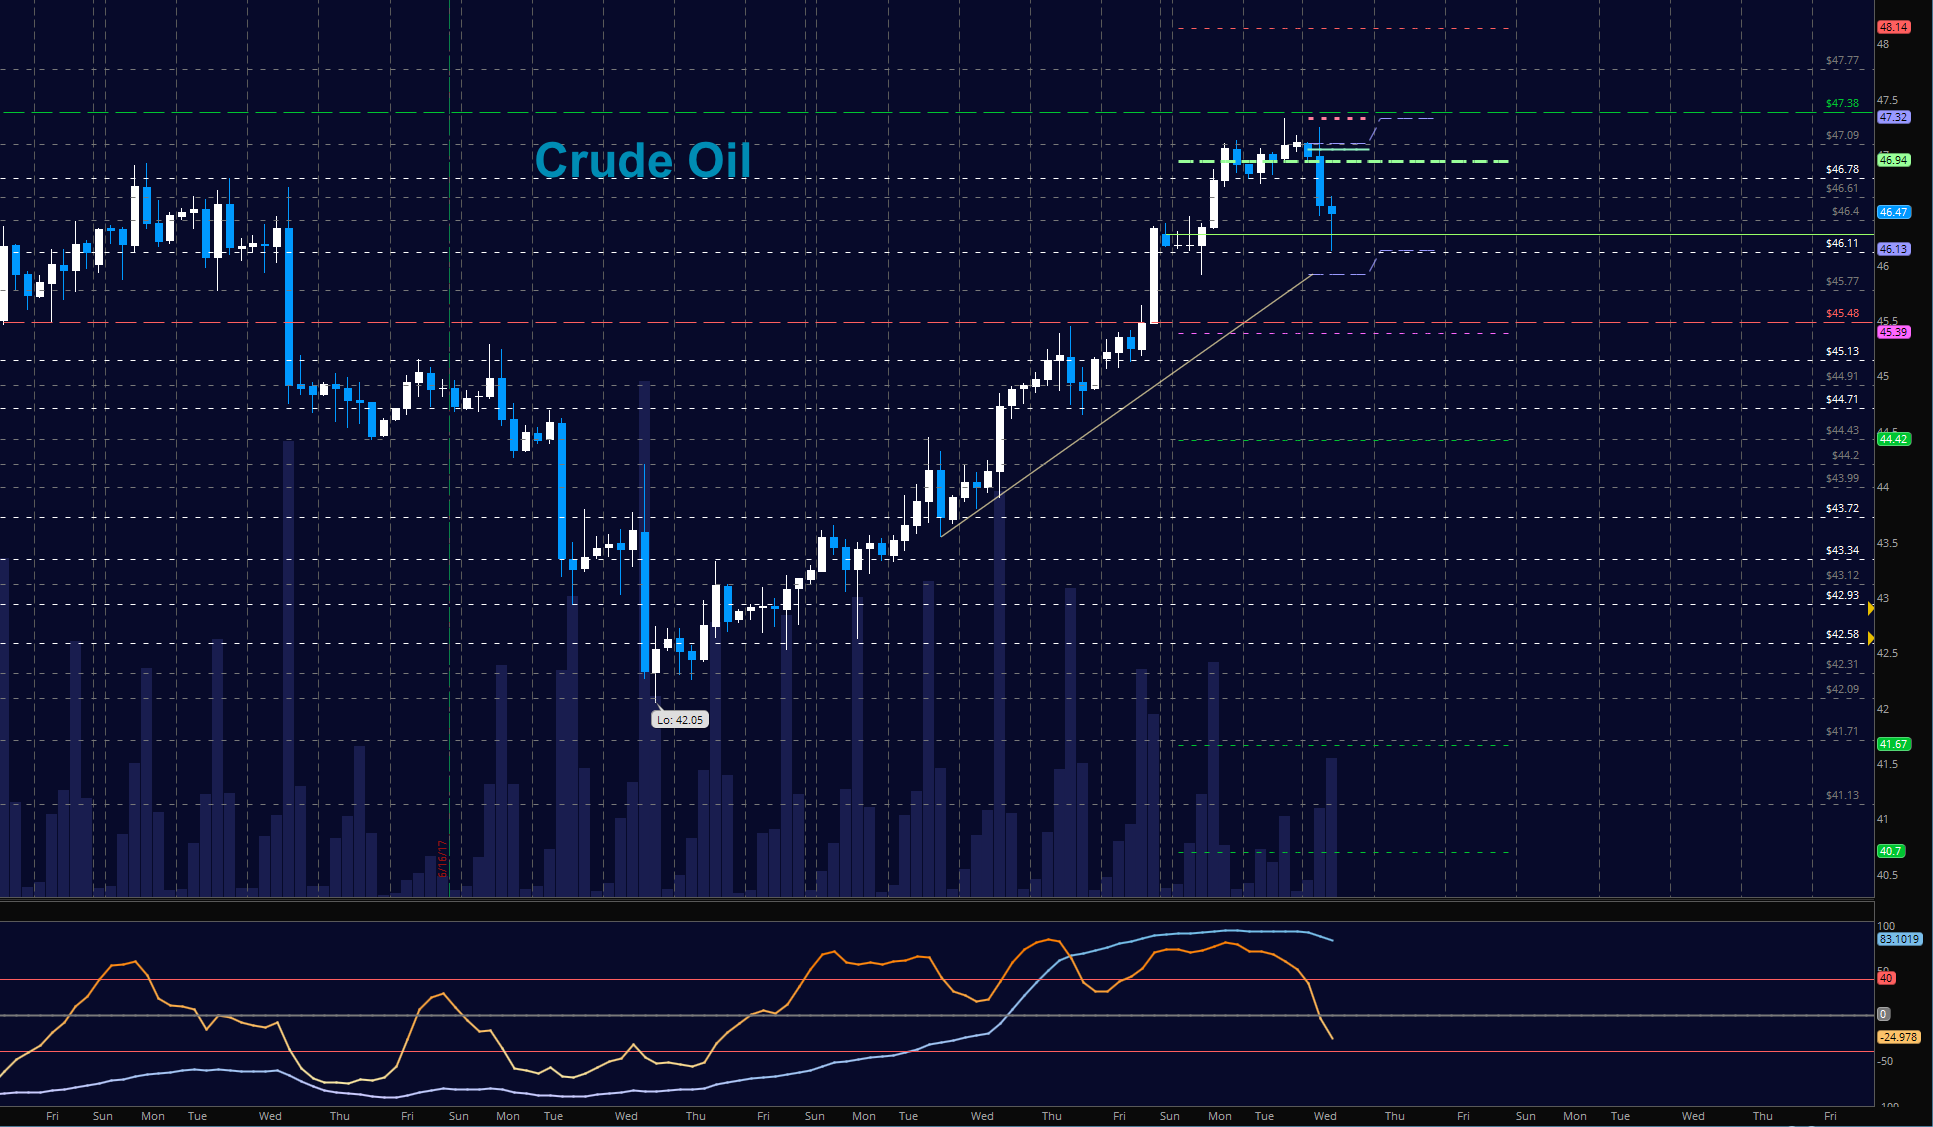
WTI Crude Oil
Tuesday’s motion in oil took it right into major resistance above 47.3 -marking the breakdown in the beginning of June. And a failed retest near 47.1 gave us the retest of new higher support near 46.1. Formations are mixed but bounces should present lower highs. Nothing about the chart suggests a short at the lows will hold. This one may be a bit messy to trade as traders find their footing. The bullets below represent the likely shift of trading momentum at the positive or failed tests at the levels noted.
- Buying pressure intraday will likely strengthen with a positive retest of 46.4
- Selling pressure intraday will strengthen with a failed retest of 45.88
- Resistance sits near 46.48 to 46.8, with 47.14 and 47.4 above that.
- Support holds between 45.9 to 45.77, with 45.48 and 45.12 below that.
If you’re interested in watching these trades go live, join us in the live trading room from 9am to 11:30am each trading day. Visit TheTradingBook for more information.
If you’re interested in the live trading room, it is now primarily stock market futures content, though we do track heavily traded stocks and their likely daily trajectories as well – we begin at 9am with a morning report and likely chart movements along with trade setups for the day.
As long as the trader keeps himself aware of support and resistance levels, risk can be very adequately managed to play in either direction as bottom picking remains a behavior pattern that is developing with value buyers and speculative traders.
Twitter: @AnneMarieTrades
The author trades stock market futures every day and may have a position in mentioned securities at the time of publication. Any opinions expressed herein are solely those of the author, and do not in any way represent the views or opinions of any other person or entity.
 Ready To Break Out?")


")
