Broad Stock Market Outlook for February 15, 2018
Buying strength has continued as charts move to recover the entire dip that began Feb 4. “Old” resistance near 2697 could easily firm up as “new” support but I expect some swings that could dip deeper into 2684.
Today, we will watch support levels now as the move and rhythm of the charts has shifted into the positive.
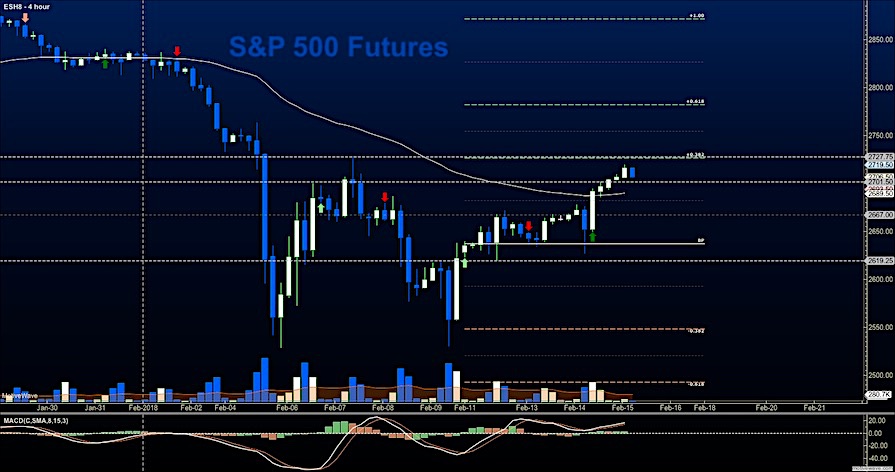
S&P 500 Futures
Price resistance sits near 2727 after the moves higher yesterday. Holding higher support regions near 2687 keeps buyers in control. Buying the pullbacks will continue to be the best bet – but now we must watch for support action to continue to hold as breaks here will signal more selling pressure. This becomes even more important if we fail to break higher. The bullets below represent the likely shift of trading momentum at the positive or failed retests at the levels noted.
- Buying pressure intraday will likely strengthen with a positive retest of 2721.5
- Selling pressure intraday will likely strengthen with a failed retest of 2701
- Resistance sits near 2716.75 to 2721.5, with 2727.25 and 2757.5 above that.
- Support sits between 2701.5 and 2689.75, with 2674.25 and 2649.5 below that.
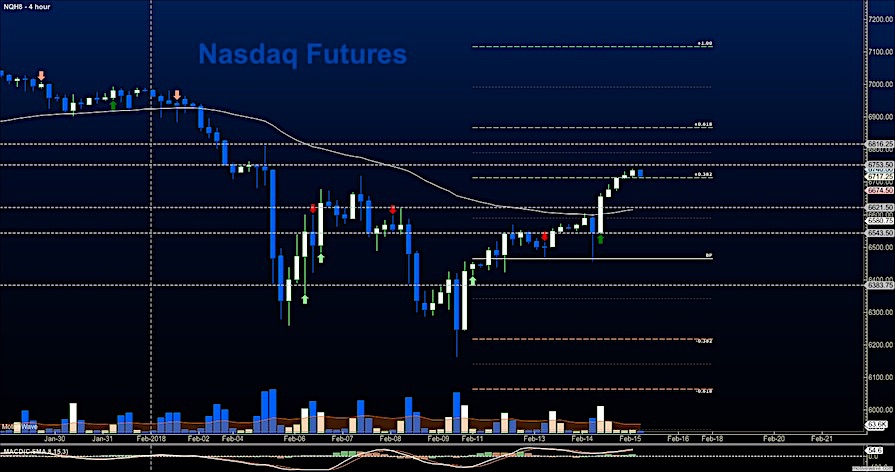
NASDAQ Futures
Momentum shifts with greater strength positive as traders recover from the deep fade last week. Selling pressure sits near 6740 this morning as traders retreat from the highs earlier. Ranges continue to be wide- support watch will be important today. The bullets below represent the likely shift of intraday trading momentum at the positive or failed tests at the levels noted.
- Buying pressure intraday will likely strengthen with a positive retest of 6737.25
- Selling pressure intraday will likely strengthen with a failed retest of 6708
- Resistance sits near 6729 to 6753.25 with 6767.5 and 6813.5 above that.
- Support sits between 6719.5 and 6709.5, with 6674.5 and 6618.5 below that.
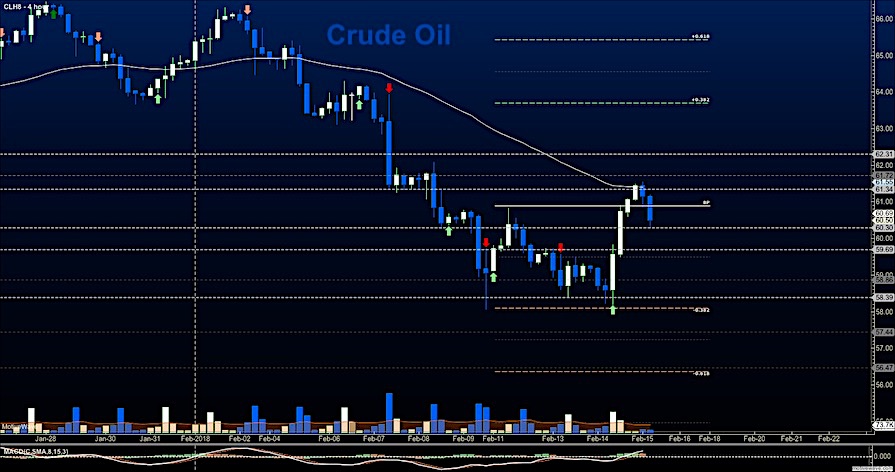
WTI Crude Oil
In a mighty bounce yesterday, traders resumed buying of the current contract with strength and shifted resistance up into areas seen early last week near 61.4. This will be resistance today as buying has subsided. Support sits near 59.76 once more. Holding the region near 60.3 makes for bullish strength across the board. The bullets below represent the likely shift of intraday trading momentum at the positive or failed tests at the levels noted.
- Buying pressure intraday will likely strengthen with a positive retest of 61.44
- Selling pressure intraday will strengthen with a failed retest of 59.6
- Resistance sits near 60.55 to 61.05, with 61.4 and 61.8 above that.
- Support holds near 60.3 to 59.67, with 58.86 and 57.44 below that.
If you’re interested in the live trading room, it is now primarily stock market futures content, though we do track heavily traded stocks and their likely daily trajectories as well – we begin at 9am with a morning report and likely chart movements along with trade setups for the day.
As long as the trader keeps himself aware of support and resistance levels, risk can be very adequately managed to play in either direction as bottom picking remains a behavior pattern that is developing with value buyers and speculative traders.
Twitter: @AnneMarieTrades
The author trades stock market futures every day and may have a position in mentioned securities at the time of publication. Any opinions expressed herein are solely those of the author, and do not in any way represent the views or opinions of any other person or entity.


 Ready To Break Out?")
 Rolling Over At Key Fibonacci Level?")


