Stock Market Futures Considerations For August 23, 2017
The S&P 500 (INDEXSP:.INX) is giving back some gains this morning. Traders will want to be aware of key price support levels (for breakdowns) and resistance (for breakouts/continuation). Below are trading levels for the S&P 500, Nasdaq, and crude oil futures.
Check out today’s economic calendar with a full rundown of releases. And note that the charts below are from our premium service and shared exclusively with See It Market readers.
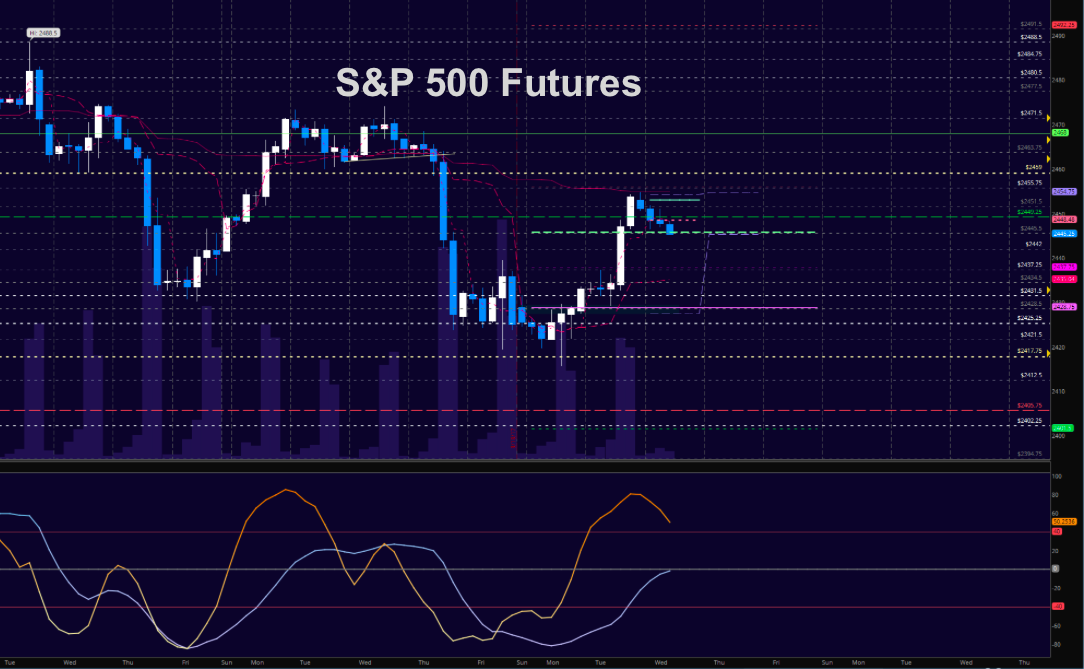
S&P 500 Futures (ES)
TRADERS are trapped between 2459 and 2435 today as they attempt to strengthen their positions in either direction. For the intraday trader, this means we will be challenged to find trend during the day. Momentum intraday is slightly bearish but suggest higher lows on the horizon. The bullets below represent the likely shift of trading momentum at the positive or failed retests at the levels noted. The bullets below represent the likely shift of intraday trading momentum at the positive or failed tests at the levels noted.
- Buying pressure intradaywill likely strengthen above a positive retest of 2455
- Sellingpressure intraday will likely strengthen with a failed retest of 2442
- Resistance sits near 2454.5 to 2459.25, with 2461.25 and 2464 above that.
- Support holds between 2445 and 2442.5, with 2437.5 and 2428.75 below that.
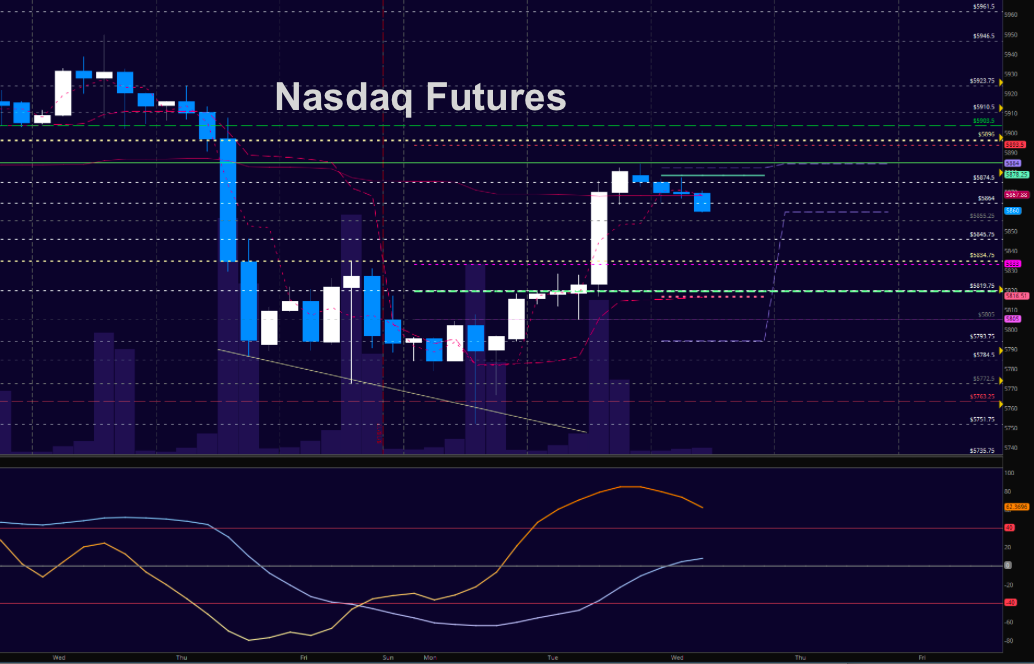
NASDAQ Futures (NQ)
As with the ES_F, the NQ_F traders are trapped between ranges – 5892 and 5816 today as they attempt to strengthen their positions in either direction. For the intraday trader, this means we will be challenged to find trend during the day. Momentum intraday is slightly bearish to neutral but suggest higher lows on the horizon. The bullets below represent the likely shift of intraday trading momentum at the positive or failed tests at the levels noted.
- Buyingpressure intraday will likely strengthen with a positive retest of 5877.75
- Sellingpressure intraday will likely strengthen with a failed retest of 5834.5
- Resistance sits near 5874.75 to 5884.75, with 5903.75 and 5911.5 above that.
- Support holds between 5855 and 5845.5, with 5834.75 and 5816.5 below that.
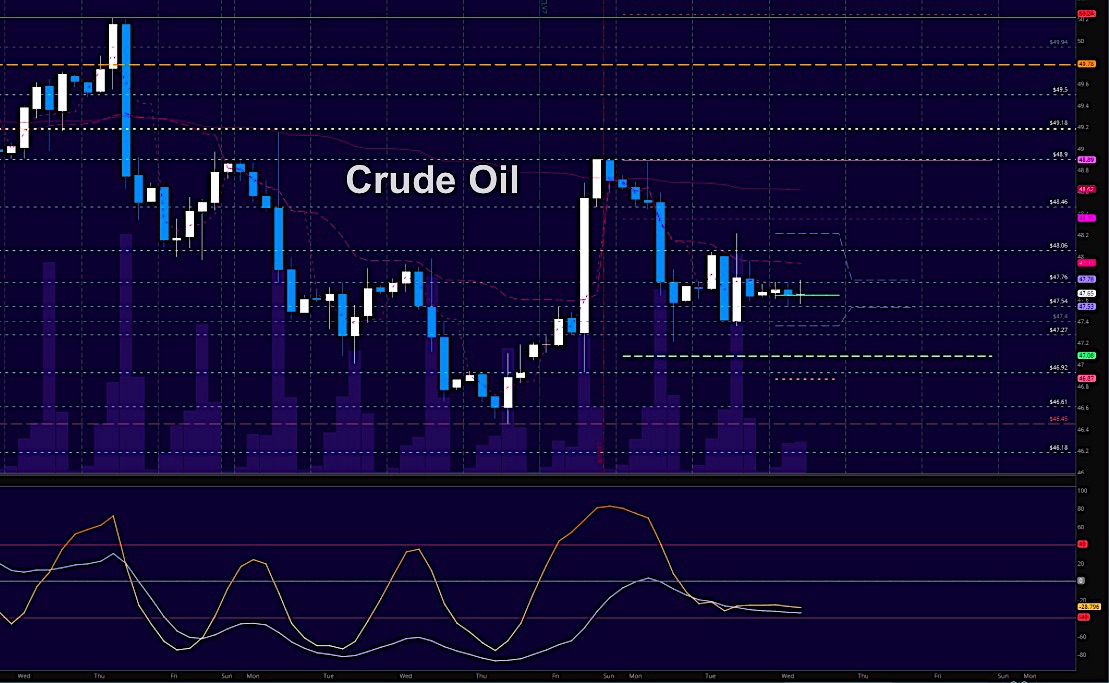
WTI Crude Oil
Today looks messy just about everywhere, and oil is no different. The EIA report is on the horizon. Momentum is mixed to negative. The bullets below represent the likely shift of trading momentum at the positive or failed tests at the levels noted.
- Buyingpressure intraday will likely strengthen with a positive retest of 48.06
- Sellingpressure intraday will strengthen with a failed retest of 47.04
- Resistance sits near 47.94 to 48.06, with 48.6 and 48.97 above that.
- Support holds between 47.4 to 47.21, with 47.09 and 46.46 below that.
If you’re interested in the live trading room, it is now primarily stock market futures content, though we do track heavily traded stocks and their likely daily trajectories as well – we begin at 9am with a morning report and likely chart movements along with trade setups for the day.
As long as the trader keeps himself aware of support and resistance levels, risk can be very adequately managed to play in either direction as bottom picking remains a behavior pattern that is developing with value buyers and speculative traders.
Twitter: @AnneMarieTrades
The author trades stock market futures every day and may have a position in mentioned securities at the time of publication. Any opinions expressed herein are solely those of the author, and do not in any way represent the views or opinions of any other person or entity.
 Ready To Break Out?")


 Ready To Break Out?")
")

