Stock Market Futures Considerations For August 21, 2017
The S&P 500 (INDEXSP:.INX) is set for more choppy trade this morning. Traders should pay close attention to support and resistance levels. Catch all my futures trading levels below for the S&P 500, Nasdaq, and crude oil.
Check out today’s economic calendar with a full rundown of releases. And note that the charts below are from our premium service and shared exclusively with See It Market readers.
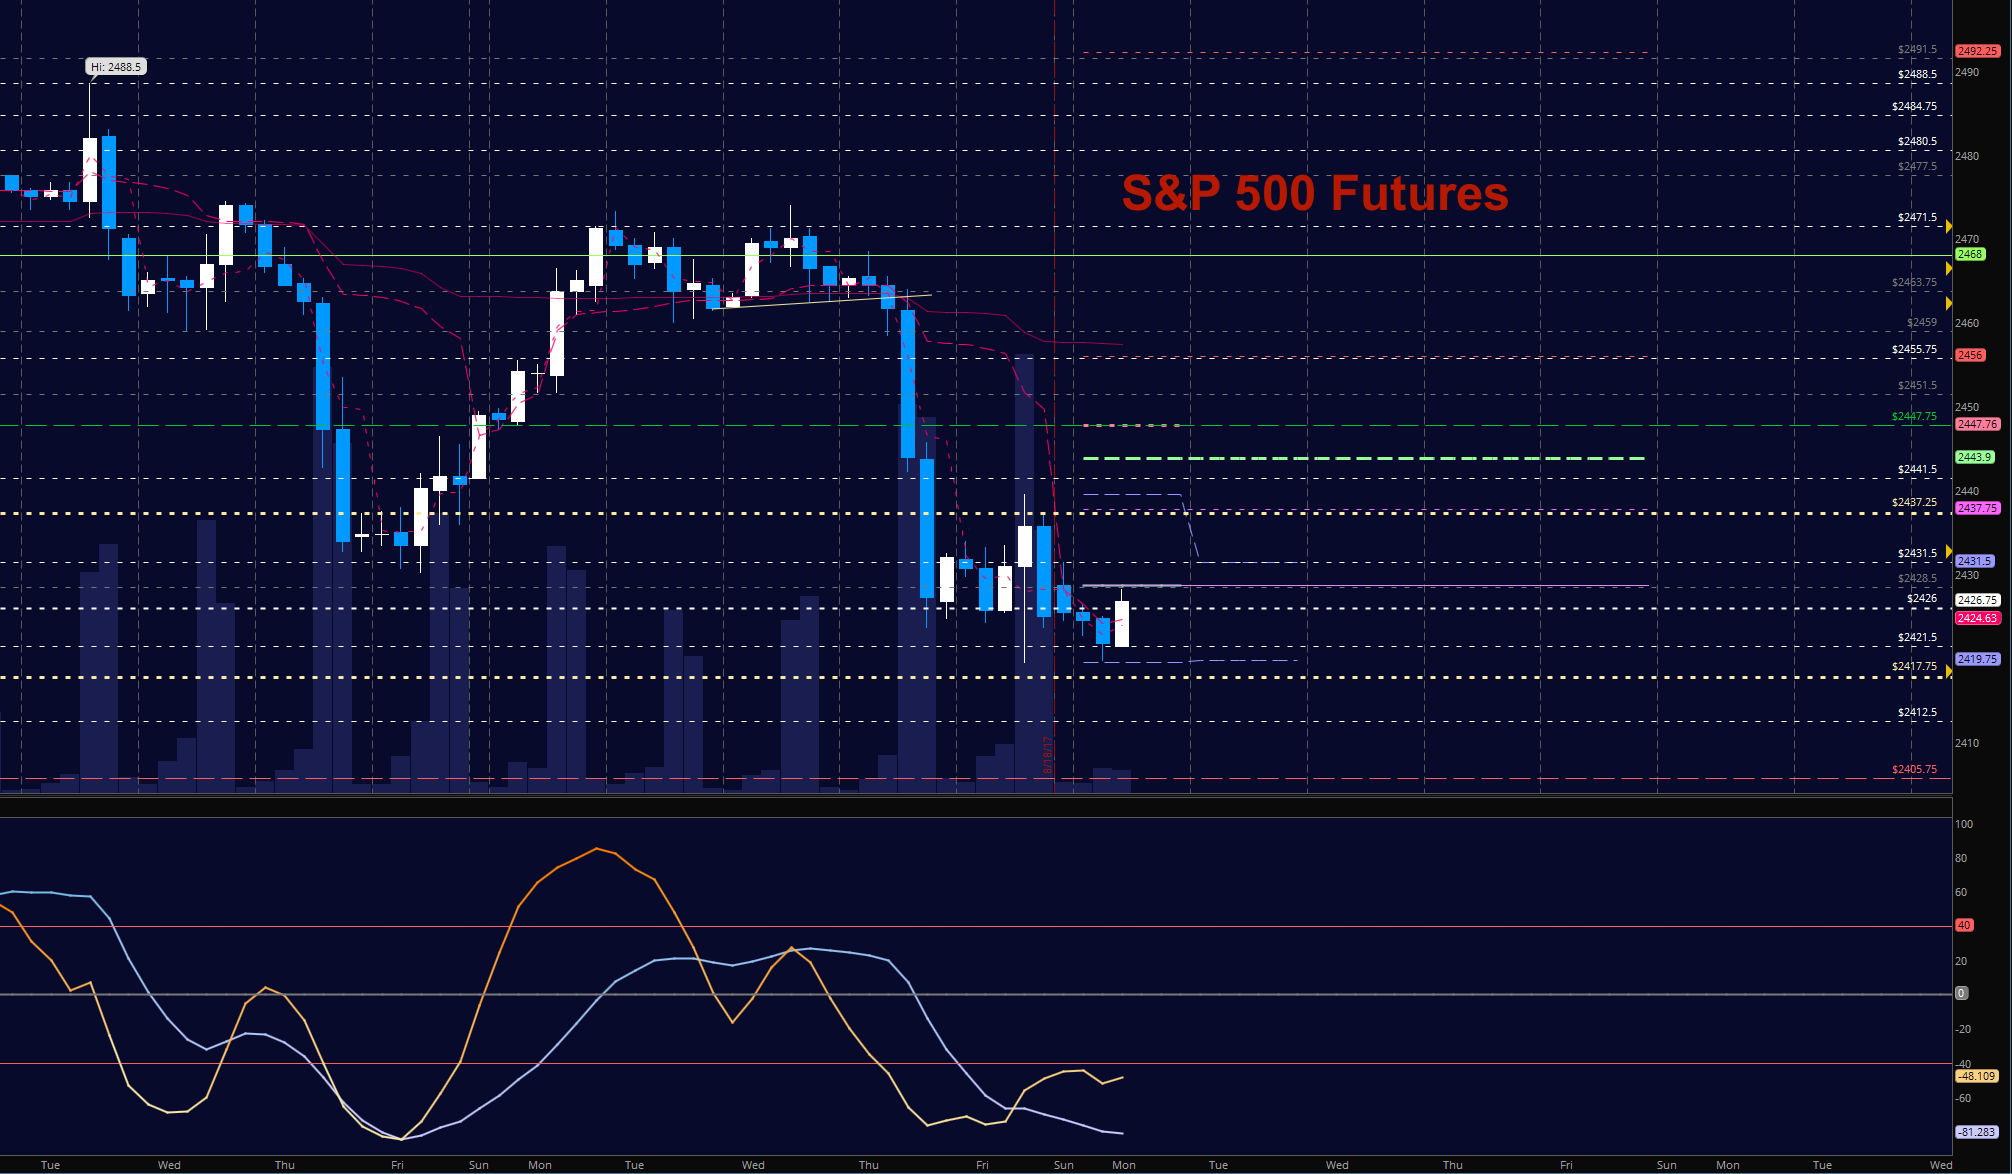
S&P 500 Futures (ES)
Charts hold lower support in the early morning once again into an important astronomical event in the US – the total solar eclipse. Sellers sit above near 2429 – a bit lower than Friday’s opening events. Bounces will find resistance and a failure to hold support will send us to even lower support again. The bullets below represent the likely shift of trading momentum at the positive or failed retests at the levels noted.
- Buying pressure intradaywill likely strengthen above a positive retest of 2431.5
- Sellingpressure intraday will likely strengthen with a failed retest of 2420
- Resistance sits near 2428.5 to 2437.5, with 2443.25 and 2451.5 above that.
- Support holds between 2424 and 2420.5, with 2417.5 and 2407.75 below that.
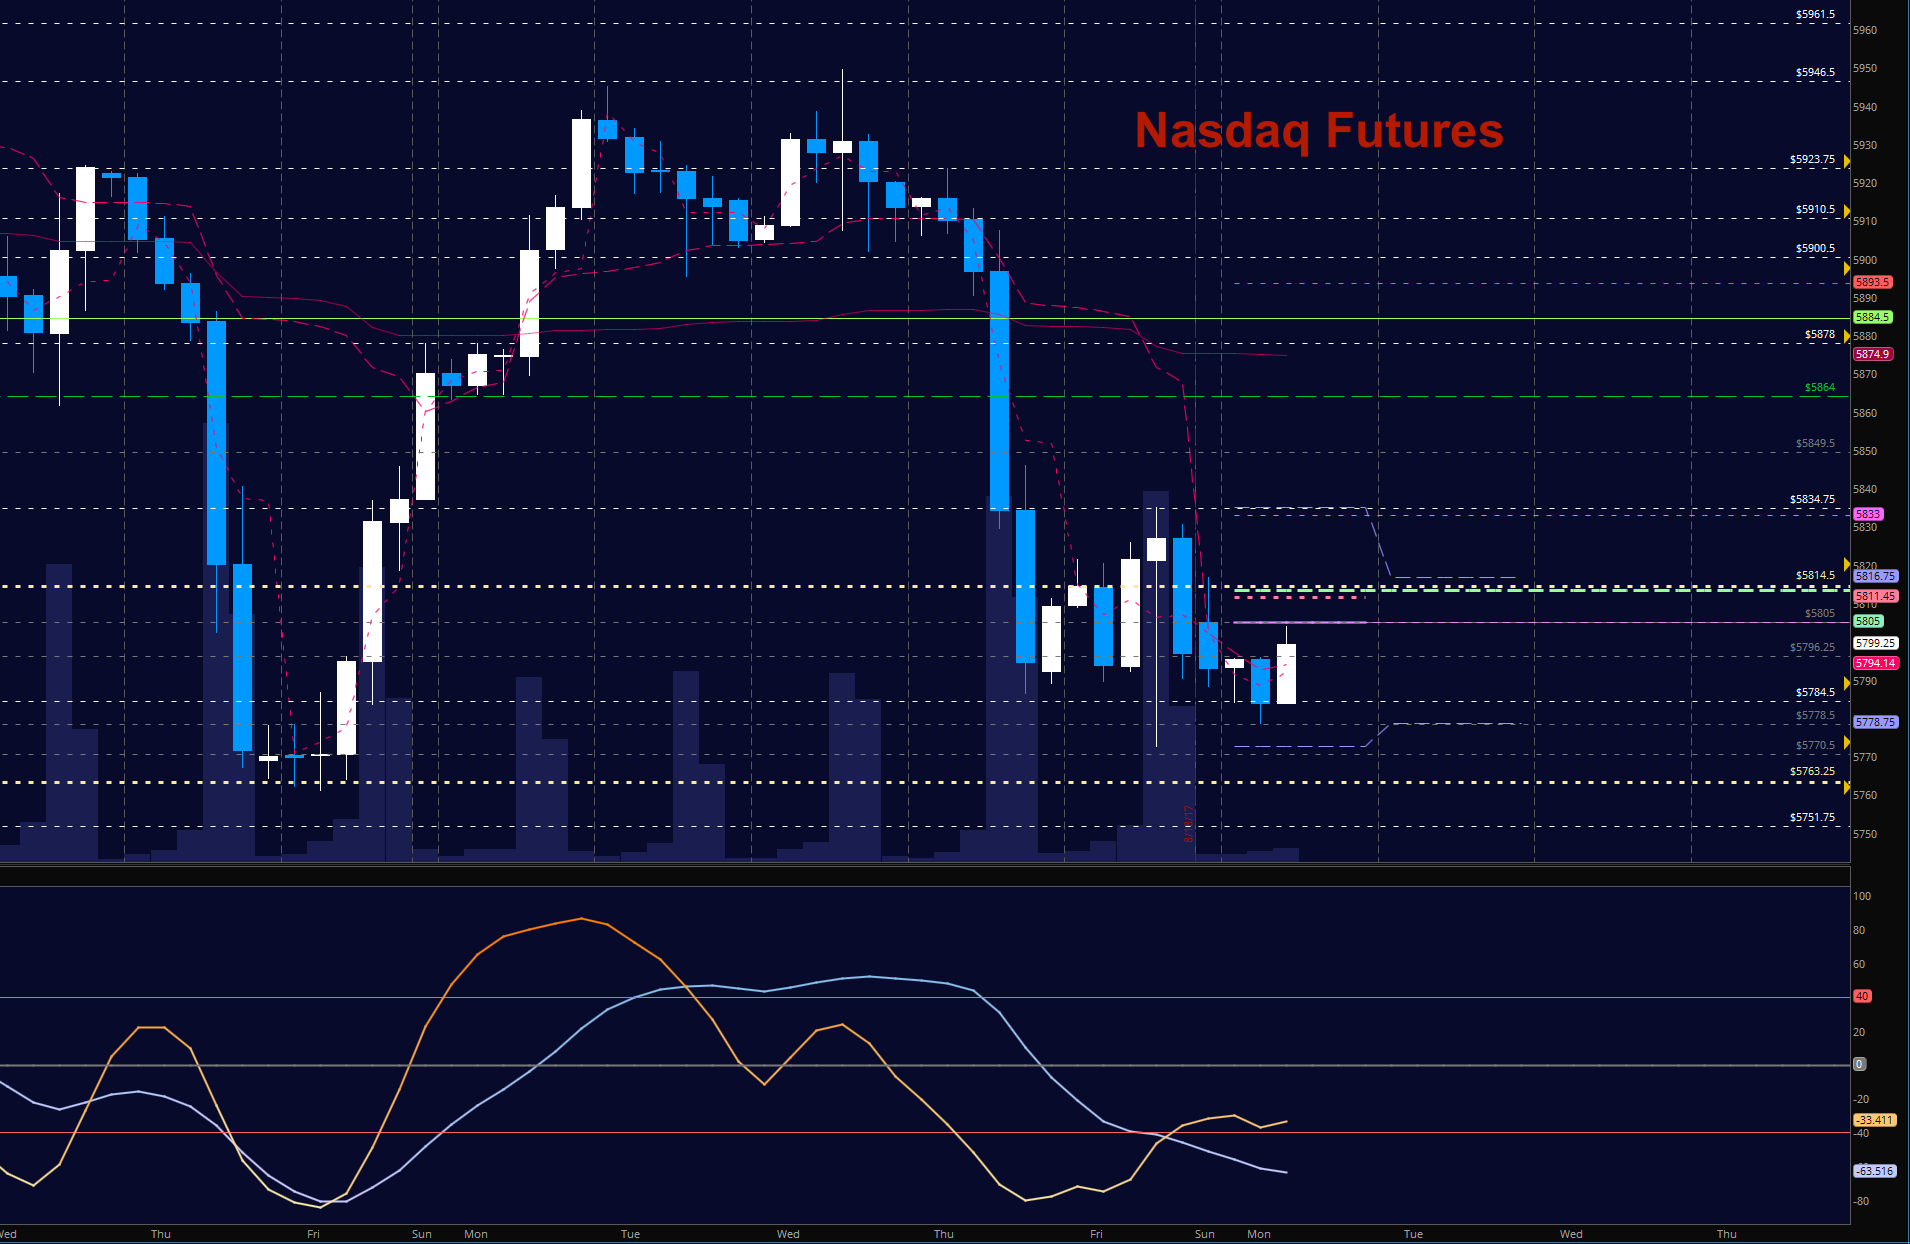
NASDAQ Futures (NQ)
Supports are holding but sellers are preventing any advance upward for another premarket. We are range bound with crosscurrents – as is the ES and YM. Resistance is now 5819 for the sellers to hold. Momentum is negative but near a potential tipping point. The bullets below represent the likely shift of intraday trading momentum at the positive or failed tests at the levels noted.
- Buyingpressure intraday will likely strengthen with a positive retest of 5822.75
- Sellingpressure intraday will likely strengthen with a failed retest of 5778.5
- Resistance sits near 5820.5 to 5835.75, with 5847.5 and 5884.5 above that.
- Support holds between 5784.25 and 5778.5, with 5770.75 and 5751.5 below that.
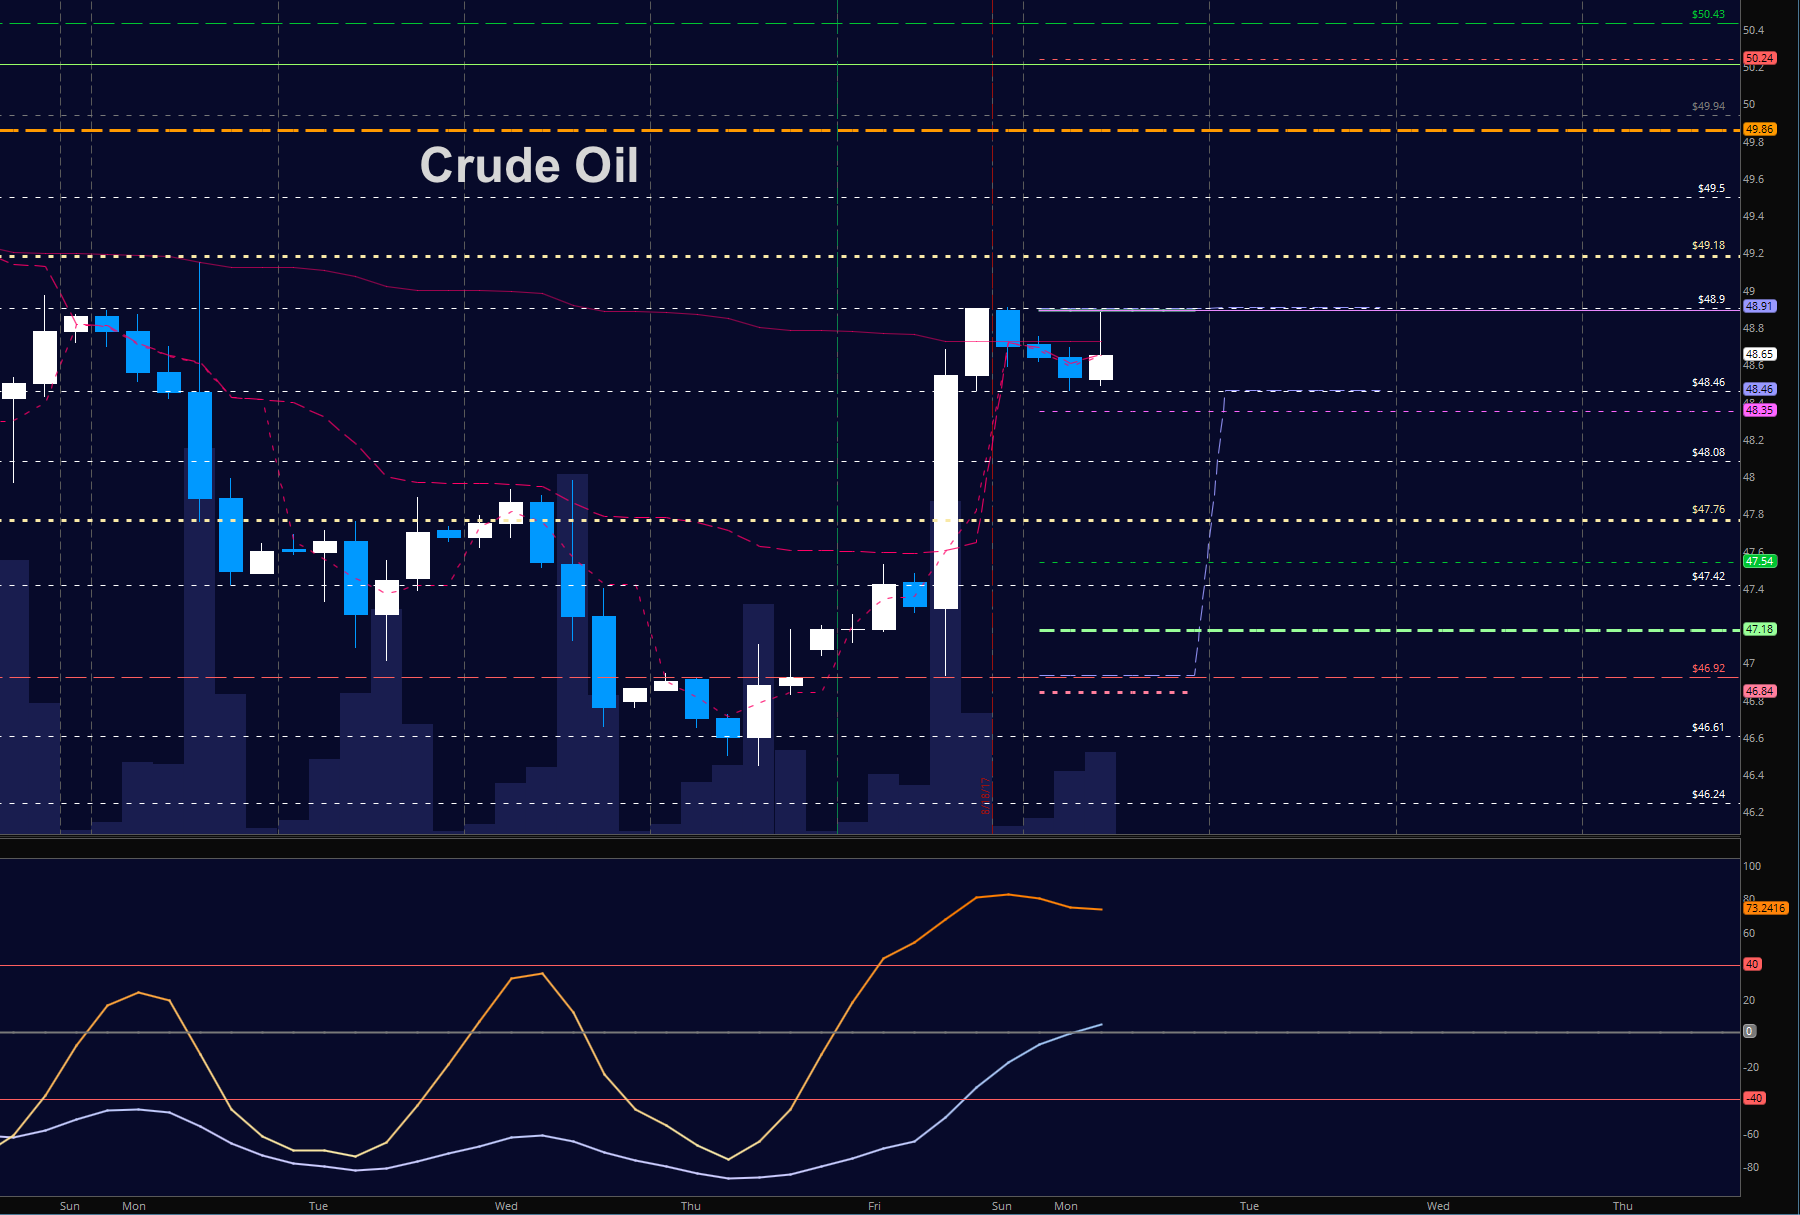
WTI Crude Oil
Bounces into resistance will still meet sellers, as they have this morning at the 48.9 area – but higher lows look to prevail for now. Momentum is mixed but largely positive on larger intraday times. The bullets below represent the likely shift of trading momentum at the positive or failed tests at the levels noted.
- Buyingpressure intraday will likely strengthen with a positive retest of 48.9
- Sellingpressure intraday will strengthen with a failed retest of 48.35
- Resistance sits near 48.9 to 49.25, with 49.36 and 49.87 above that.
- Support holds between 48.35 to 48.08, with 47.94 and 47.54 below that.
If you’re interested in watching these trades go live, join us in the live trading room from 9am to 11:30am each trading day. Visit TheTradingBook for more information.
If you’re interested in the live trading room, it is now primarily stock market futures content, though we do track heavily traded stocks and their likely daily trajectories as well – we begin at 9am with a morning report and likely chart movements along with trade setups for the day.
As long as the trader keeps himself aware of support and resistance levels, risk can be very adequately managed to play in either direction as bottom picking remains a behavior pattern that is developing with value buyers and speculative traders.
Twitter: @AnneMarieTrades
The author trades stock market futures every day and may have a position in mentioned securities at the time of publication. Any opinions expressed herein are solely those of the author, and do not in any way represent the views or opinions of any other person or entity.
 Rolling Over At Key Fibonacci Level?")


 Rolling Over At Key Fibonacci Level?")

