Broad Stock Market Futures Outlook for May 18, 2018
As Fridays have the tendency to be more bullish than other days, we’ll keep our eyes on the break of resistance and the potential move to higher zones. Our fades are consistently supported by buyers in the otherwise bullish spaces.
It looks like a triple witching expiration day, which may make the last hour of trading today quite volatile.
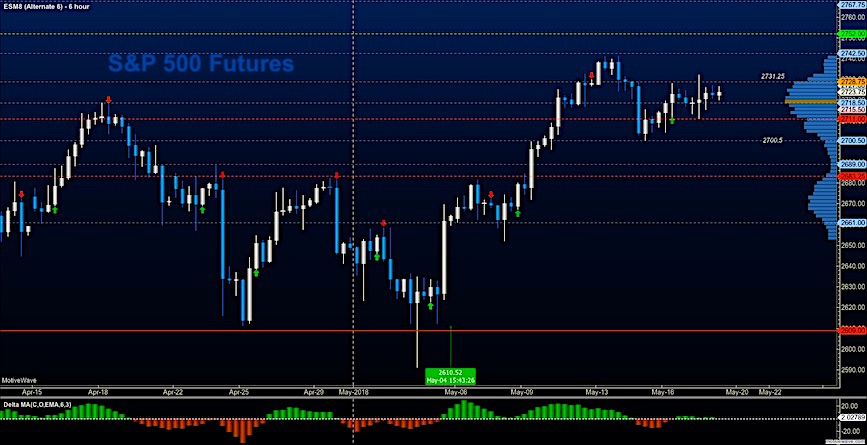
S&P 500 Futures
Ranges have tightened since yesterday as the current contract comes into expiration- The level near 2711 is currently a solid support zone and above 2629, we could easily accelerate higher though treasuries and gold are holding a bit steady at support for now (if we assume that inverse relationship will contain movement today). The bullets below represent the likely shift of trading momentum at the successful or failed retests at the levels noted.
- Buying pressure intraday will likely strengthen with a bullish retest of 2727.75
- Selling pressure intraday will likely strengthen with a bearish retest of 2711
- Resistance sits near 2727 to 2731.75, with 2739.75 and 2744.5 above that.
- Support sits between 2712 and 2700.5, with 2694.5 and 2689.25
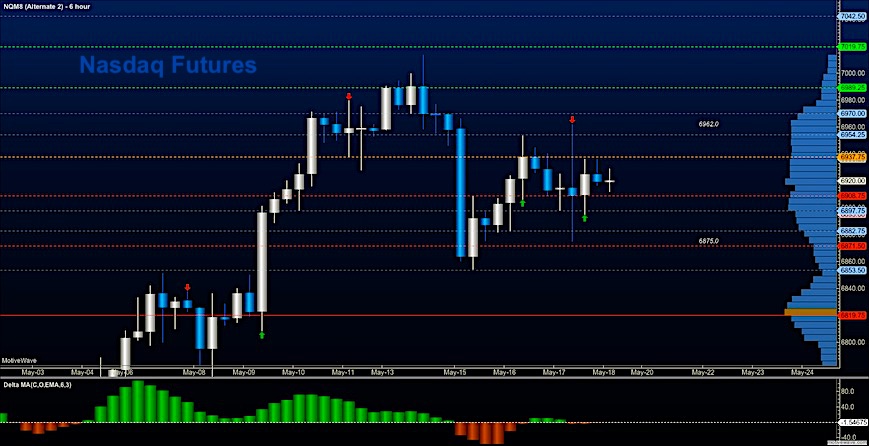
NASDAQ Futures
Our ranges hold while wicks stretch the edges. The big picture still shows range bound behavior as the summer rolls on. The bullets below represent the likely shift of trading momentum at the successful or failed retests at the levels noted.
- Buying pressure intradaywill likely strengthen with a bullish retest of 6937.75
- Selling pressure intradaywill likely strengthen with a bearish retest of 6897.50
- Resistance sits near 6937.25 to 6950.5 with 6970.5 and 6989.25 above that.
- Support sits between 6908.75 and 6894.5, with 6882.75 and 6853.5 below that.
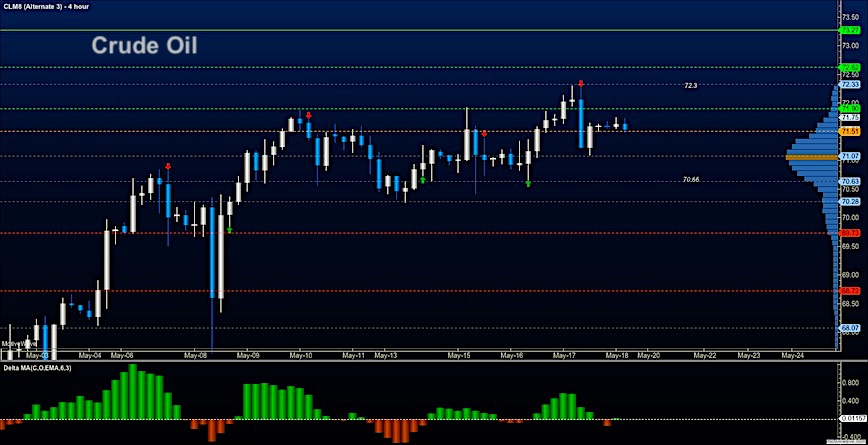
WTI Crude Oil
This current contract also expires so I suspect that bounces will bring sellers to the party. Sellers will become more aggressive with a failure to support 71, though selling should hold steady below 71.5. The bullets below represent the likely shift of trading momentum at the successful or failed retests at the levels noted.
- Buying pressure intraday will likely strengthen with a bullish retest of 71.92
- Selling pressure intraday will strengthen with a bearish retest of 71.50
- Resistance sits near 72.24 to 72.62, with 72.97 and 73.47 above that.
- Support holds near 71.06 to 70.63, with 70.28 and 69.56 below that.
Twitter: @AnneMarieTrades
The author trades stock market futures every day and may have a position in mentioned securities at the time of publication. Any opinions expressed herein are solely those of the author, and do not in any way represent the views or opinions of any other person or entity.


