The February 24 stock market futures outlook shows the S&P 500 futures heading lower into key support. S&P 500 futures broke its rising wedge on intraday patterns yesterday during trading hours with the failure of 1914, and now we are on the hunt for support below – probably between 1899 and 1892.
The Morning Report: Heading Into Lower Support Zones
If buyers step out of the way, a move to 1880-1884 is most likely. A bounce off 1900 needs to quickly recapture 1909, or the bounce will likely fail. A move above 1914 would be very good for buyers to gain momentum.
Momentum on the four hour chart is negative, but in neutral territory. Daily charts for stock market futures see momentum as trending mildly positive, and approaching neutral territory – suggesting failures into support levels with buyers coming to the rescue at the base of congestion near 1892 on S&P 500 futures. Moving averages present good opportunities for buyers to enter off support tests.
Shorter time frame momentum indicators are sitting in negative territory, and sloping down. Positive divergence is holding in longer time frames for now but still suggest price action that will be jagged.
See today’s economic calendar with a rundown of releases.
THE RANGE OF TUESDAY’S MOTION
Crude Oil Futures (CL_F)
Crude oil futures collapsed under selling pressure yesterday and continues to move downward. API shows another big build and Saudi Oil Minister actually said it was shale production causing the pricing issues, not their production. Momentum is negative, so bounces should be sold.
Today, the trading ranges are between 29.46 and 32.8.
Moving averages on crude oil futures are still mixed across longer intraday time frames across the board-daily and weekly charts still show primarily negative trend. Four hour time frames show moving averages flat to down, with negative momentum beneath that is increasing.
Intraday long trading setups on crude oil futures suggests a long off 31.2 positive retest, or 30.65 bounce into 31.2, 31.54, 31.75 and if buyers hold on, we’ll see 32.2 to potentially 32.8 (outside chance of this-quite unlikely unless the EIA surprises).
Intraday short trading setups suggest a short below a 30.6 failure or a failed retest of 31.68 with negative divergence showing sends us to 31.2, 30.78, 30.36, 30.11, and if sellers get a real foot hold 29.74 to 29.46.
Have a look at the fibonacci levels marked in the blog for more targets.
E-mini S&P 500 Futures (ES_F)
Below is a S&P 500 futures chart with price support and resistance trading levels for today. Click to enlarge.
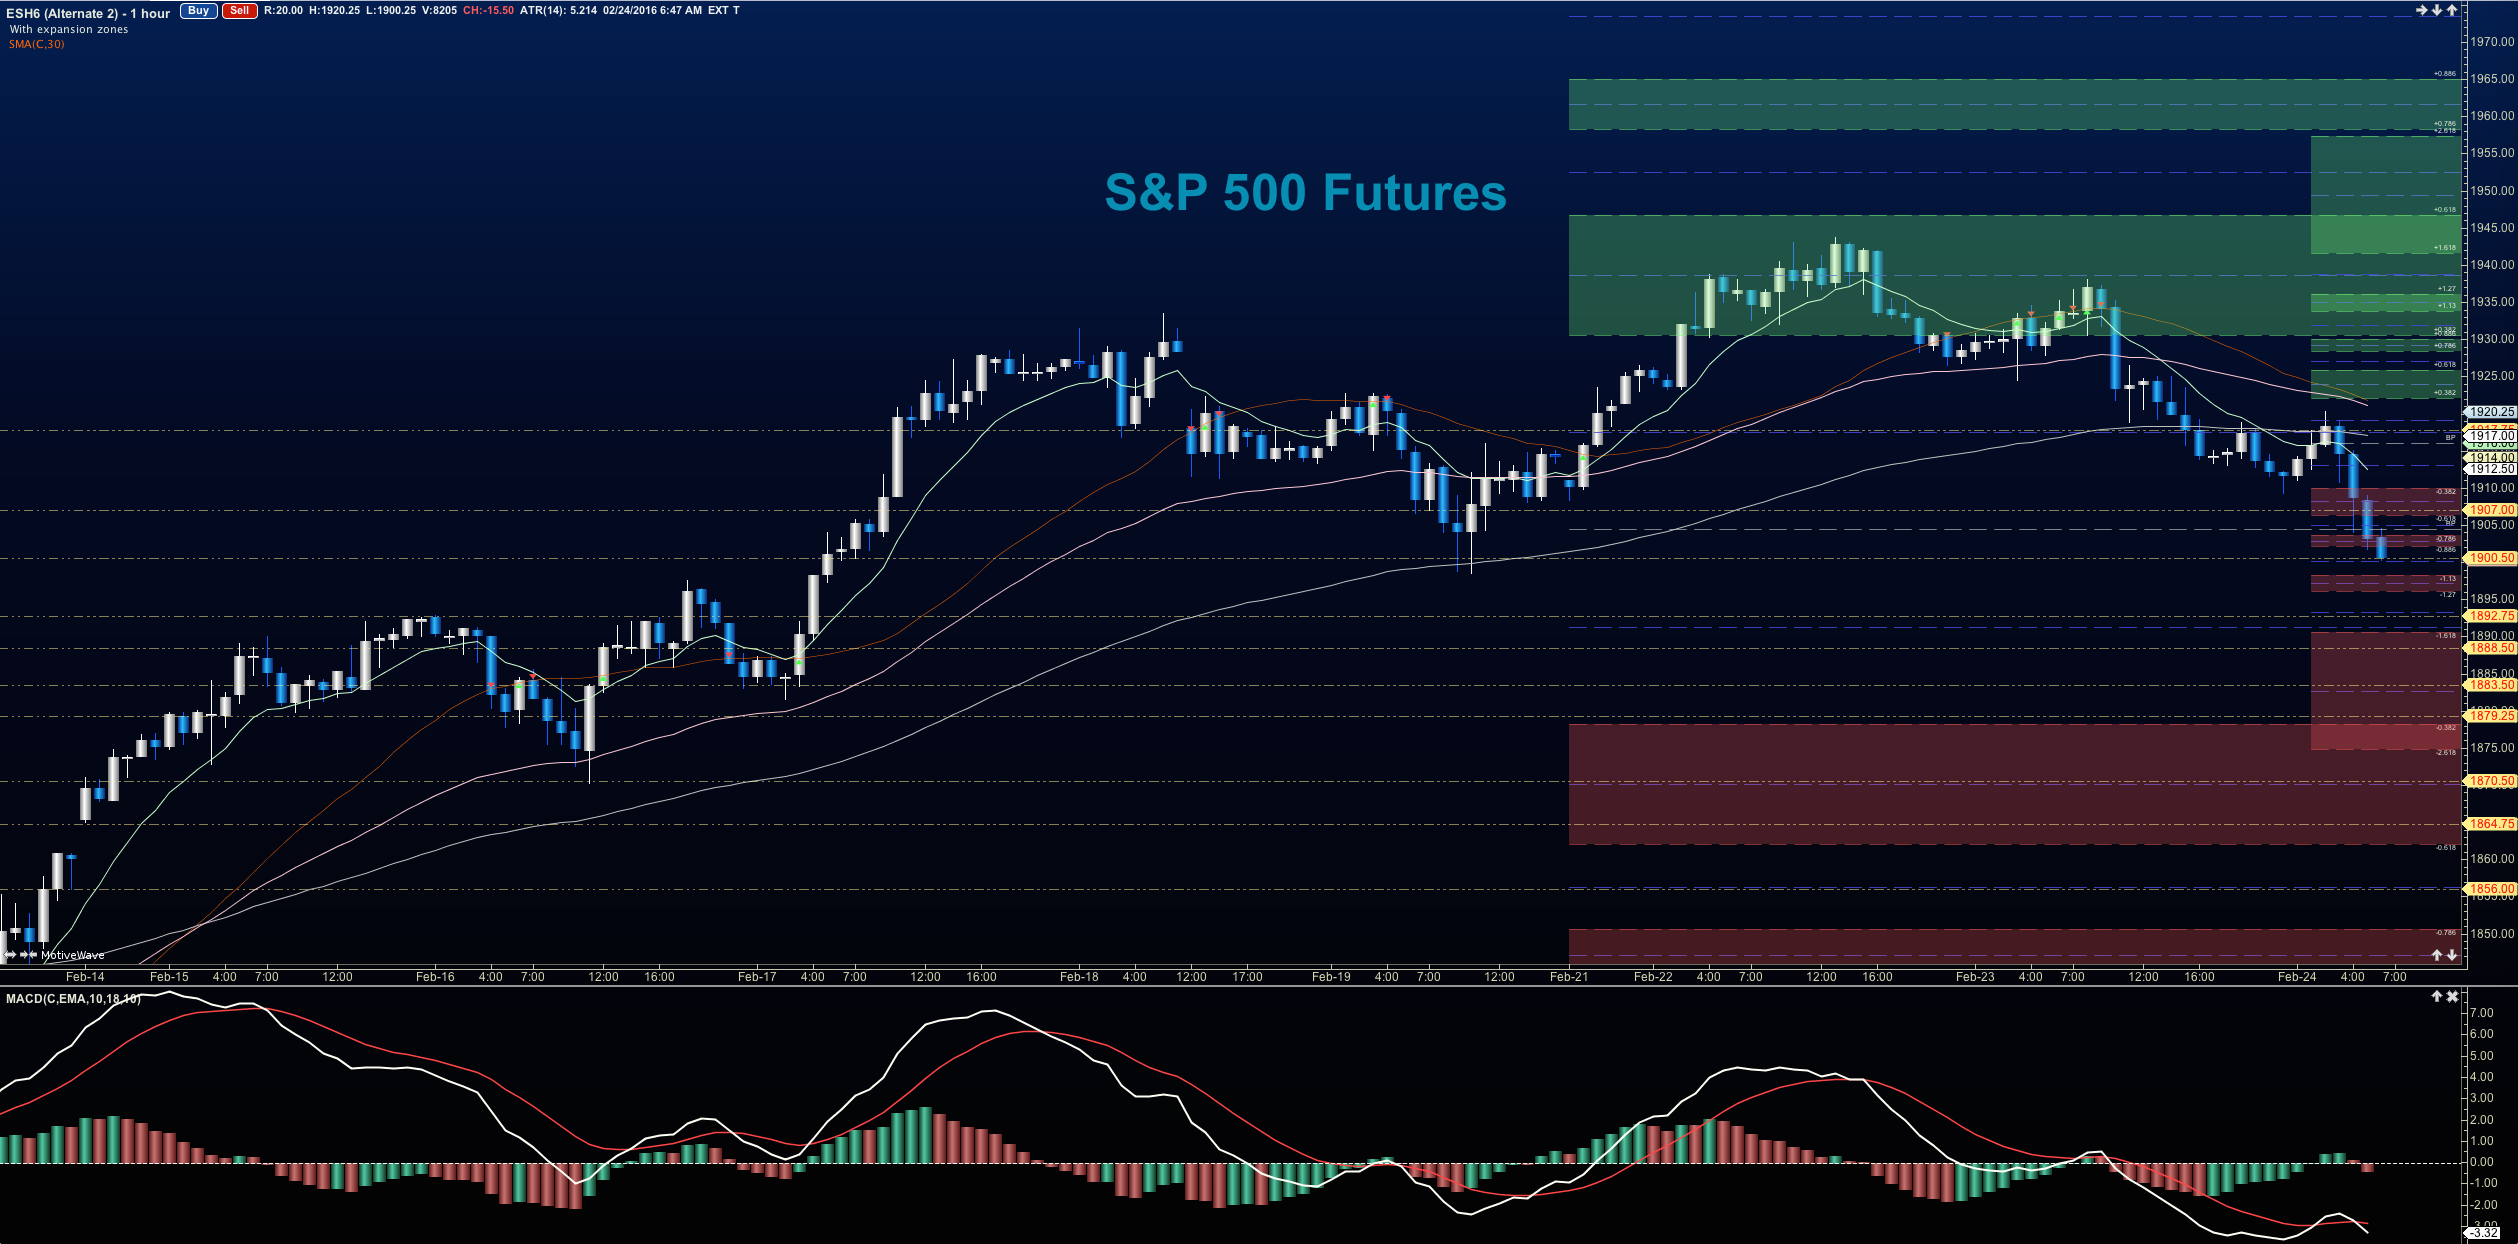
The S&P 500 futures chart is struggling at the 1900 level. There is the widely accepted idea that whole numbers hold (I’m not in that camp =), so I suspect a bit of a struggle there and then the move continues downward into support near 1894. The region to recapture and hold today will be 1909-1911. If S&P 500 futures can climb back over that, charts will be less vulnerable to sellers, and move into resistance above.
Upside motion has the best setup on the positive retest of 1894.75 (watch momentum here; it may have trouble near 1899.75)- or a retest and hold of 1906. Targets from 1906 are 1908.25, 1911.5, 1914.25, 1916.75 and if we can catch a bid there, we could expand into 1923-1929. Big resistance test sits at the region between 1931-1936. Watch the higher lows to keep you on the right side of the long trade. Charts look quite weak and undecided here but the undercurrent long needs to be considered as it still appears on the daily and weekly time frames.
Downside motion opens below the failed retest of 1905.5 or at the failed retest of 1914 with negative divergence. Retracement into lower levels from 1905.5 gives us the targets 1902.25, 1899.5, 1894.5, 1892.25 and perhaps 1888.75. If buyers do not provide support there, we’ll see the also familiar 1880 – 1884 levels once more.
Have a look at the fibonacci levels marked in the blog for more targets.
If you’re interested in the live trading room, it is now primarily stock market futures content, though we do track heavily traded stocks and their likely daily trajectories as well – we begin at 9am with a morning report and likely chart movements along with trade setups for the day.
As long as traders remain aware of support and resistance levels, risk can be very adequately managed to play in either direction as bottom picking remains a behavior pattern that is developing with value buyers and speculative traders.
Twitter: @AnneMarieTrades
The author trades stock market futures every day and may have a position in mentioned securities at the time of publication. Any opinions expressed herein are solely those of the author, and do not in any way represent the views or opinions of any other person or entity.
 Ready To Break Out?")


")


