It has been a rough month for investors.
The S&P 500 Index fell 6.6% for the month of May, ending each of the four weeks lower than the previous week.
There were several warning signs (I wrote about them here and on twitter) – they included the Russell 2000 and Dow Industrials non-confirmation of the S&P 500 and NASDAQ all-time highs along with waning momentum and market breadth. Crude oil also turned sharply lower along with bond yields.
So is this shaping up to be a run-of-the-mill correction (7-12 percent)? Or something more ominous? The S&P 500 Index is currently off by 6.8%, so the jury is still out. I started “picking” a bit on Friday and plan to buy in increments on further declines.
Note that the following MarketSmith charts are built with Investors Business Daily’s product suite.
I am an Investors Business Daily (IBD) partner and promote the use of their products. The entire platform offers a good mix of technical and fundamental data and education.
Here’s my tweet from Thursday looking at the S&P 500 “daily” chart with comments on DeMark setup count and Fibonacci levels:
$SPX S&P 500 is on bar 6 of a TD daily 9 buy setup. #IBDpartner
— Andy Nyquist (@andrewnyquist) May 30, 2019
IF this setup continues, we should see a trading bottom early next week. Testing 200 day MA. Could we see gap-fill at 2743? 38.2 Fib is also at 2722. @MarketSmith –> https://t.co/5XqPXLvv5c pic.twitter.com/zyN7oxoUH1
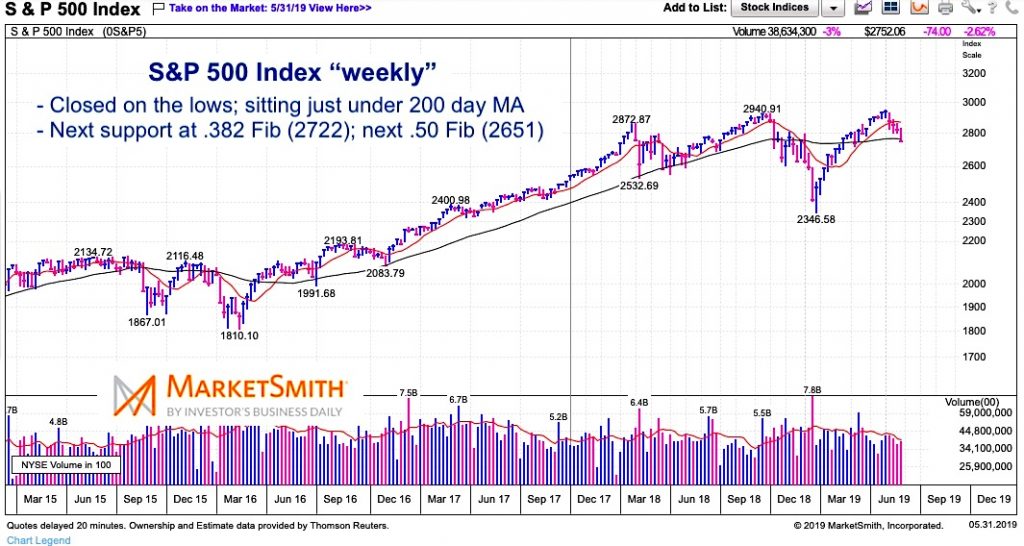
S&P 500 “weekly” Chart
The S&P 500 Index has recorded four consecutive “down” weeks and closed just below its 40 week moving average and (200 day moving average).
The next support resides at the .382 Fibonacci level of 2722, followed by a broad price area of 2632 to 2695 that includes the .500 Fibonacci level at 2651.
These potential price supports are weighed against several concerns, including US – China trade tension, recent comments on tariffs (trade) with Mexico, sharply declining bond yields and crude oil. It’s always darkest before dawn. Reminder: stock market prices take these “known” concerns into consideration, which is why I follow price and price indicators.
One scenario that could play out is a momentum low next week, followed by a retest of sorts some time later that may or may not undercut that low… just food for thought, best to take it day by day.
Twitter: @andrewnyquist
The author has a position in mentioned securities at the time of publication. Any opinions expressed herein are solely those of the author, and do not in any way represent the views or opinions of any other person or entity.


 Ready To Break Out?")
")


