Key Takeaways:
Stocks rallying into resistance with longer-term trends still challenging. Breadth has not moved into a leadership position, and the message from cyclical leaders is mixed (though improving). Emerging markets are gaining strength. Watch sentiment indicators for evidence of renewed optimism.
Stocks have continued to move off of their late-2018 lows, buoyed in part by breadth thrusts that have recently emerged. As we discussed in this space last week (After Evidence of Panic, Breadth Thrusts Could Buoy Market), historical tendencies suggests some sort of re-test of the lows is more likely than not. While that is the pattern, enough historically unusual things have happened of late that we do not want to rule anything out.
We will watch for evidence that the rally off the lows may be fading as well as evidence that it is becoming more robust and persistent.
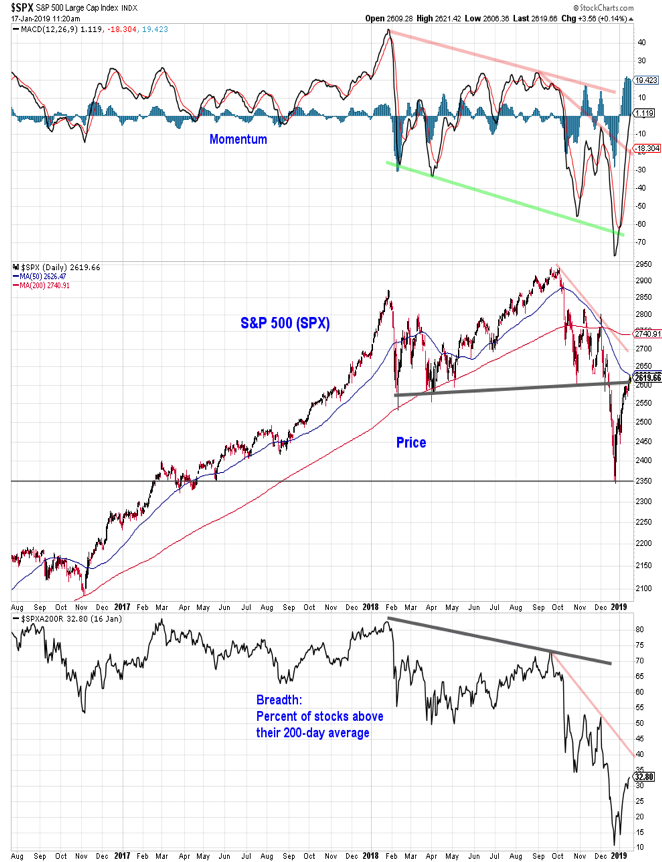
From a price perspective, the S&P 500 has drifted through resistance near 2600 and is challenging its 50-day average near 2625. The down-trend off of the October and November highs (currently near 2700) could represent the next resistance level. Momentum has already cleared the down-trend that emerged in the fourth quarter of 2018, which could bode well for further near-term upside in terms of price.
The longer-term momentum picture remains challenging, and breadth, while improving has not moved into a leadership position relative to price.
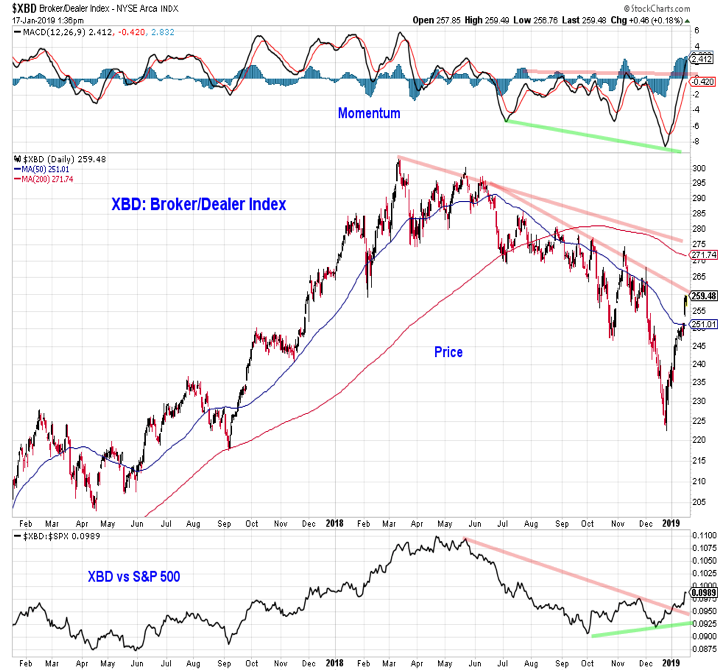
If the rally off of the Christmas Eve lows is more than just a pessimism-fueled oversold bounce (and there is little evidence from the S&P 500 chart at this point to argue that this is the case), we would expect to see cyclical leaders experience improving relative strength. That is indeed what can be seen when looking at the Broker/Dealer index. While overall price is running into down-trend resistance, momentum is breaking out to the upside, and the sector has seen significant relative price improvement. Versus the S&P 500, the Broker/Dealer Index made a higher low in December and has broken above the down-trend that emerged over the course of 2018. Continued leadership out of the Broker/Dealer index, and Financials overall, would have bullish implications for stocks in general as well as the economy.
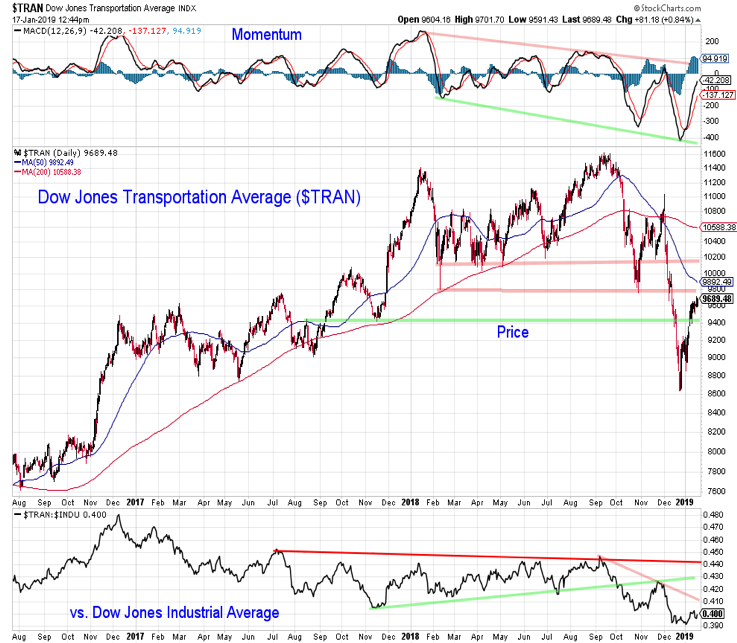
Another area to look for relative leadership would be from the Dow Transports. The message here is not as encouraging. It is more inconclusive than a clear negative at this point. Resistance remains intact across the indicators on the chart – most notably from a momentum and relative price perspective. Breaking above those down-trends would echo the more bullish signal being sent by the Broker/Dealer index.
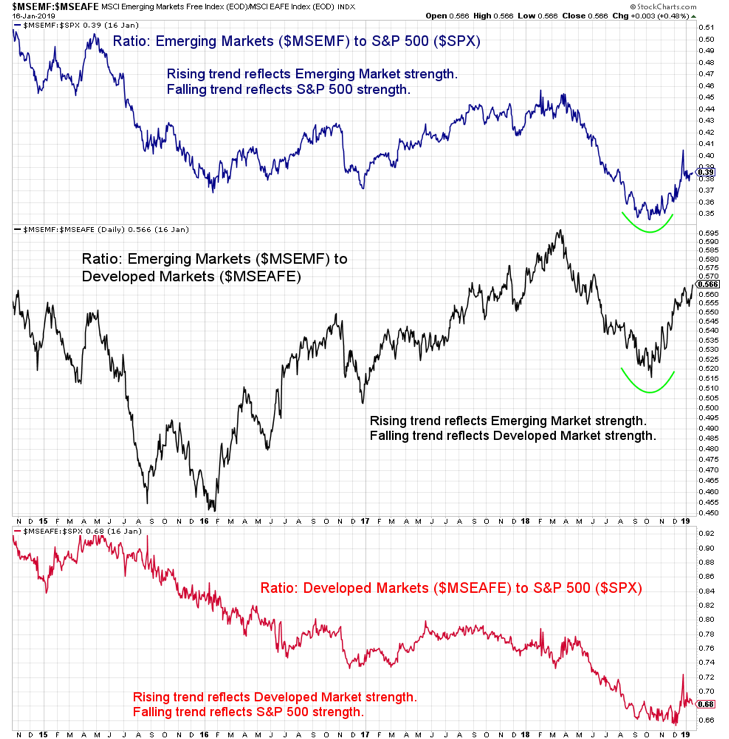
A look at relative trends on a global basis shows that both Emerging Markets and Developed Markets have started to turn higher relative to the S&P 500 after seeing sustained weakness for most of 2018. Emerging Markets are also gain strength relative to Developed Markets. Leadership out of Emerging Markets would suggest global growth concerns have been overdone. This could help sustain the rally in the U.S. as well.
The caveat is that the strength of the move toward Emerging Market leadership may not be known until it is tested – and so far it has not been tested. While the initial move is encouraging, it could be too early to draw firm conclusions.
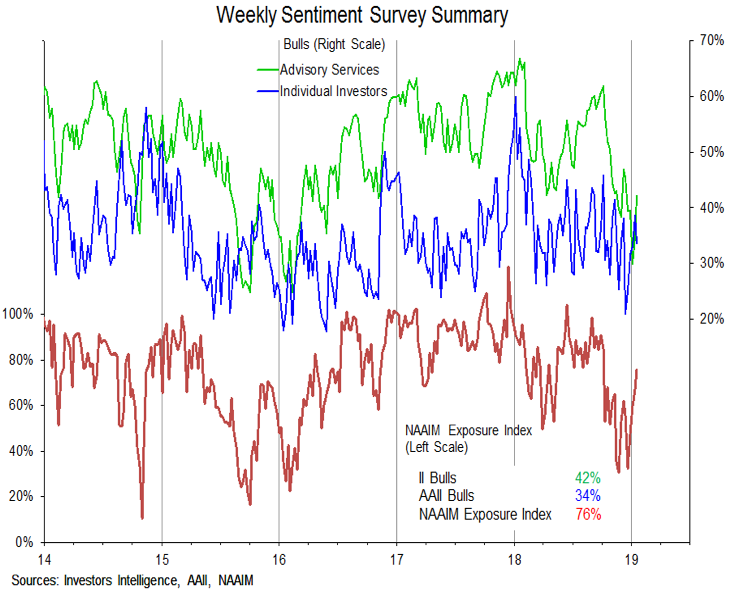
While deteriorating business confidence could weigh on the economy – the sentiment risk for the stock market is in the opposite direction (a quick return to optimism could be a headwind for stocks).
The sentiment data remains mixed for now – mostly suggesting an easing in the widespread pessimism that was present in December. One exception to that is this week’s NAAIM data, which showed the Exposure index climbing up to 76% and into the optimism zone. Countering this is the AAII data which showed more bears than bulls for the fifth time in six weeks.
Twitter: @WillieDelwiche
Any opinions expressed herein are solely those of the author, and do not in any way represent the views or opinions of any other person or entity.

 Rolling Over At Key Fibonacci Level?")


