The news, while at times informative, interesting and sometimes sensational, is usually intended to report what has happened.
Take, for instance, the following hard facts about Q2 corporate earnings:
425 of the S&P 500 constituents have now reported Q2 earnings results and earnings are down about 43% from the same quarter last year.
Now, by adding additional factual context, like comparing the decline in corporate earnings with the fact that the last time earnings dropped by this much was around the global financial crisis, is interesting but can also veer towards the sensational.
Let’s dissect this narrative more closely.
Importantly, you will not likely have much success investing if you are only focused on the narratives out there. Rather, to become a bit more proficient, you need to consider the facts relative to expectations; In other words, what analysts, investors, “the market”, economists were expecting.
The fact is, the Q2 corporate earnings decline was less of a drop than what most were expecting, making this apparent bad news story into a good one. And to get even better at investing, you need to consider expectations about the future and figure out where and when those expectations have gone too far in any one direction.
That is the sweet spot and is the essence of contrarian investing, which can be lonely.
Q2 Earnings – The facts
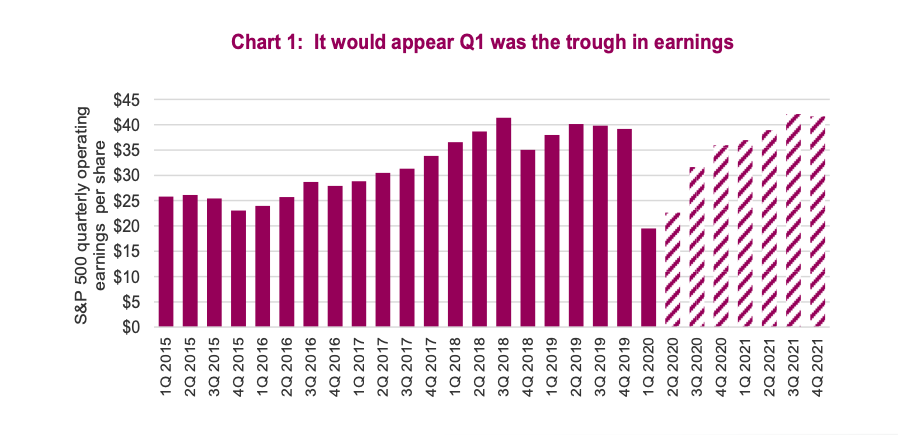
With Q2 corporate earnings about 90% complete, it would appear Q1 was the trough in earnings resulting from the pandemic and global recession. Not surprising, the hardest hit sectors included those that are the most sensitive to the broader economy.
Energy and Consumer Discretionary appear to be posting negative earnings in Q2, while Industrials, Financials, Communication Services and Materials are posting big double-digit declines. Utilities and Health Care are the only two sectors with Q2 operating earnings higher than the same quarter last year. Top-line sales have painted a similar picture.
S&P 500 sales/revenue for Q2 are down about 13%, led lower by Energy, Industrials and Consumer Discretionary. Technology, Health Care, Consumer Staples and Utilities h eld up better with roughly flat sales from the previous quarter.
It’s “relative to expectations” that matters
The above-mentioned results certainly do not sound very encouraging, yet markets have reached new highs. One contributing factor to the market’s resilience has been earnings results relative to consensus analyst estimates (expectations). This was an interesting earnings season.
Last quarter, given how quickly the pandemic spread and shut down parts of the global economy, analysts were too slow in adjusting their estimates. Complicating matters, many companies removed guidance after their Q1 results, as they simply had no clue how the next quarter or the rest of the year would transpire. This left analysts to their own devices (i.e. their imagination) and it would seem they became too bearish. But companies managed the pandemic better, cutting costs and adjusting to the new environment.
Indeed, 84% of companies exceeded the consensus forecasts for earnings so far in Q2. With earnings data going back 15 years, that is the highest positive surprise rate. Even more impressive has been the size of the “beats”. Normally companies beat expectations as company guidance follows the mantra of “underpromise and over deliver”. But with a void of guidance, analysts ended up becoming way too pessimistic. The result, therefore, has been that the size of the aggregate or average surprise has been around 20% (see chart below).
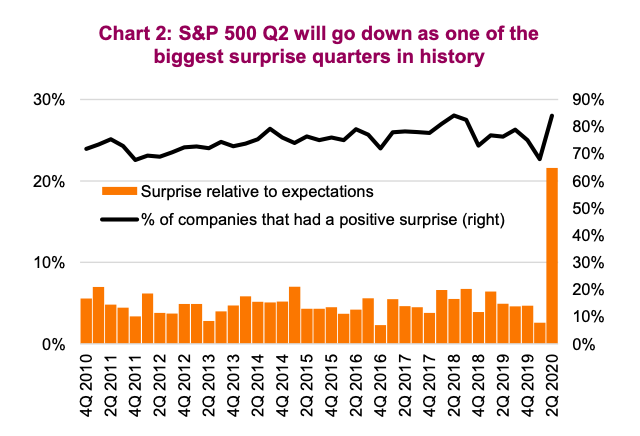
That is a lot higher than the normal 4-6%. Companies have done a better job managing this recession/pandemic than most analysts thought they would.
Don’t fight the trend, but be careful
We certainly understand that recent changes in behavior are greatly benefiting a few companies; behavior like upgrading your iPad, watching more streaming content, shopping online, saving some money for the upcoming vaccine, etc. This changed behavior is why the NASDAQ is up +22% this year, the less tech/biotech-focused S&P500 is up just +3% and the
more economically sensitive Dow Jones Industrial Average Index is down -4%.
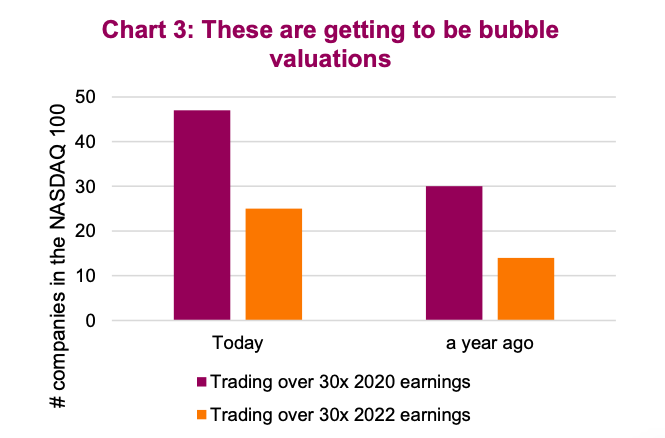
However, many of the companies benefiting have reached rather challenging valuations. Almost 50% of the NASDAQ 100 is trading over 30x estimates. Even more alarming is the fact that about 25% are trading over 30x 2022 earnings. For many, these companies are priced to perfection. And given these details fall into the realm of facts versus what the market is expecting or pricing in, this can be a risk.
One market risk for these valuations that may surprise most is a successful vaccine – more on that in an upcoming Market Ethos.
Source: All charts are sourced to Bloomberg L.P. and Richardson GMP unless otherwise stated.
Twitter: @ConnectedWealth
Any opinions expressed herein are solely those of the authors, and do not in any way represent the views or opinions of any other person or entity.

 Rolling Over At Key Fibonacci Level?")

 Rolling Over At Key Fibonacci Level?")


