A few days back I discussed October stock market seasonality in this blog post.
The point of that post was to show that a typical October sees the S&P 500 (INDEXSP:.INX) bottom around October 9th.
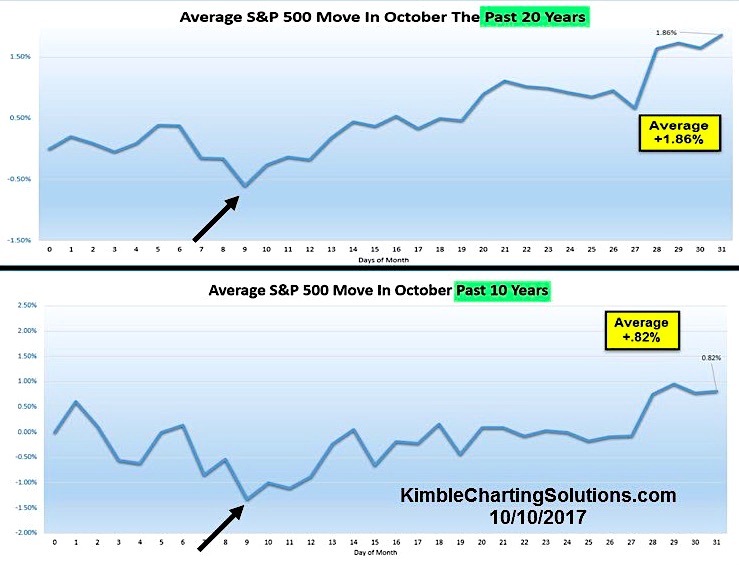
I’m sharing that chart again with you here on See It Market (see below). As you can see, it includes the S&P 500’s performance over the past 10 years and 20 years.
Both composite’s yield similar results: 1) An October 9 bottom 2) A move higher after October 9. In fact, the average gain after October 9 through month end is 1 percent (on both charts).
Stocks have trended a bit higher since October 9, but they are very overbought. So a bigger question is: Will this seasonality keep stocks afloat into month end? It’s been one heck of a year for equities again.
S&P 500 Index: October Monthly Seasonality (10 & 20 year composites)
Twitter: @KimbleCharting
Any opinions expressed herein are solely those of the author, and do not in any way represent the views or opinions of any other person or entity.


