Over the years, the NYSE Index has been a good indicator of broad market health and breadth. So what is this index telling us now?
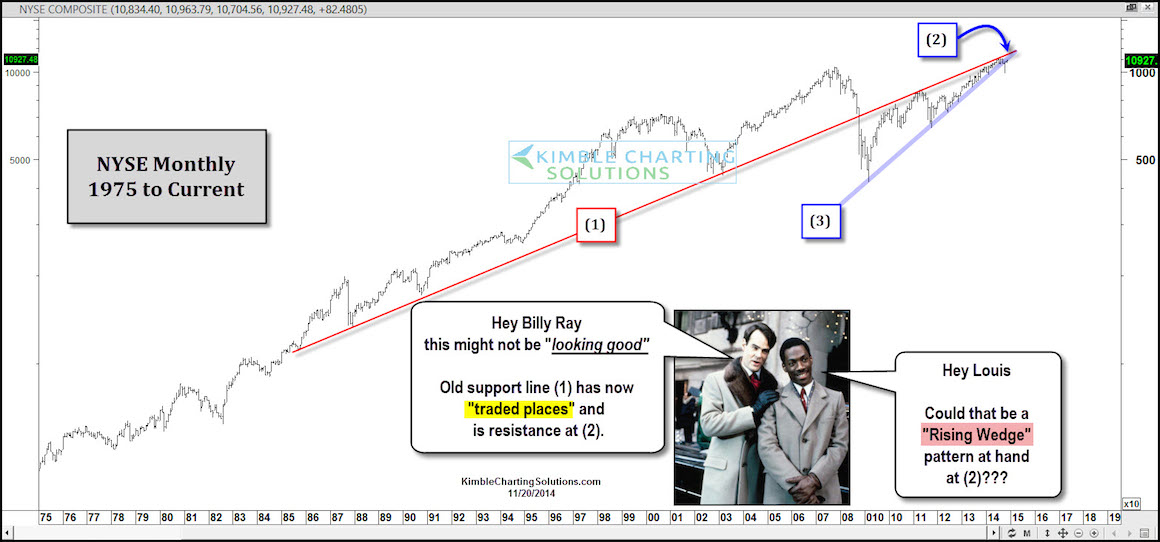
The chart below takes a 30,000 foot view of the NYSE Index over the past 40 years. Line (1) has been important support at some key times in financial history. The 1987 crash low found line (1) to be support, as well as the 2002-2003 stock market lows.
The decline during the financial crisis broke this support line. Since the NYSE is currently trading below line (1), this line becomes potential resistance.
In 2011, the last time the NYSE and S&P 500 hit this resistance line, they experienced a 15% decline. Now the NYSE is hitting the underside of line (1), marked as resistance point (2) on the chart.
At the same time, a long-term rising wedge may have formed. With line (1) trading places and becoming resistance, it is important that the NYSE does not break support the line (3)!
Lastly, a break above resistance would be a positive for the NYSE, as a trading places moment (resistance to support) would be taking place again!
NYSE Index Monthly Chart – 1975-Present
Trade well and stay disciplined! Thanks for reading.
Follow Chris on Twitter: @KimbleCharting
No position in any of the mentioned securities at the time of publication. Any opinions expressed herein are solely those of the author, and do not in any way represent the views or opinions of any other person or entity.


