The decline in Natural Gas prices has been stealth. And the correction may continue for a while longer.
Natural Gas futures prices are moving lower yet again today. And this move lower has seen a key price support level fail (at $2.72).
I highlighted this level in my last update here on See It Market (Note: that article includes a cool Natural Gas seasonality chart).
How low can Natural gas prices go?
Today’s technical breakdown puts deeper price support levels on the radar. Below are some key price levels and indicators to think about, including potential downside price support targets.
- 50-day: $2.99 (flat slope), 200-day: $3.03 (flat slope)
- Natural Gas Price Seasonality: December is rather boring with no trend, and has been positive 50% of the past 20 Decembers with an average “gain” of just 0.1%. January is quite bearish with 65% of the past 20 Januaries being NEGATIVE; the average loss for January since 1998 is -4.5%, the worst of all months.
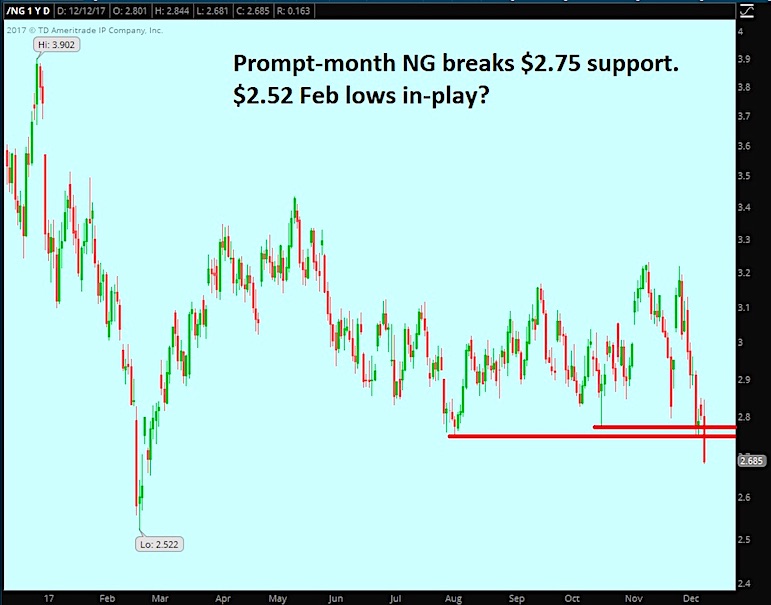
- Support lingers in the $2.52-$2.55 now that the $2.72-$2.75 has broken (see attached)
Natural Gas Chart
Twitter: @MikeZaccardi
Any opinions expressed herein are solely those of the author, and do not in any way represent the views or opinions of any other person or entity.


")

 Rolling Over At Key Fibonacci Level?")

