The dot com crash was brutal. But even in the demise of several tech stocks, investors knew that technology was our future.
And for the past 20 years technology stocks have been outperforming the broader market and leading the major stock market indices higher.
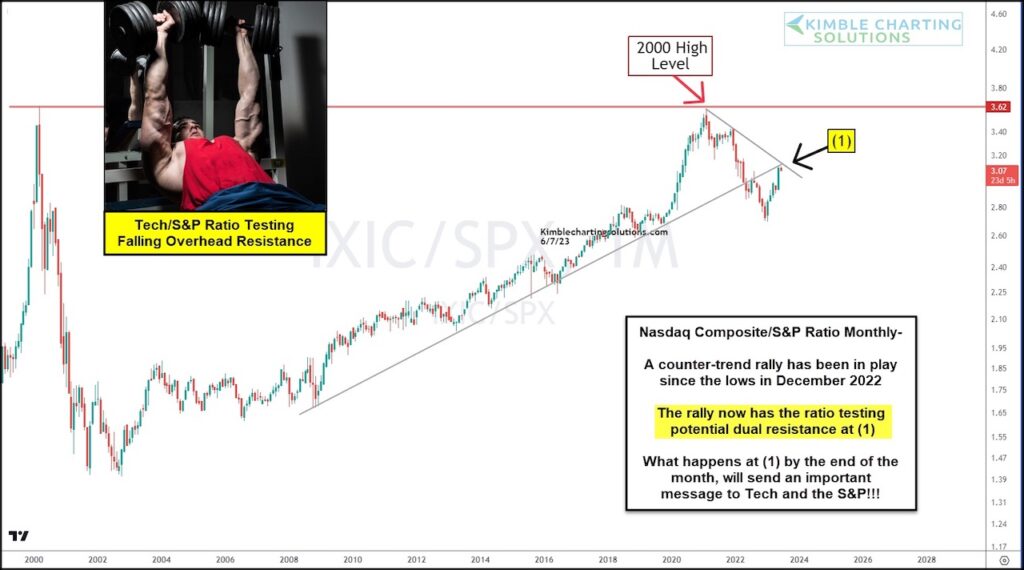
This comes into focus today, with a long-term “monthly” chart depicting the price ratio of the Nasdaq Composite to the S&P 500 Index. Here we can see that the Nasdaq has been outperforming over the past 20 years.
HOWEVER, if we zoom in on the past 3 years, we can see that the ratio hit the 2000 high level and reversed lower. This reversal broke down below its rising trend line before staging a counter-trend rally.
Currently, the Nasdaq/S&P 500 ratio is testing dual resistance at (1). This could put the counter-trend rally at risk of a setback.
In my humble opinion, where the ratio stands at the end of the month could send a very important message to stocks! Stay tuned!
Nasdaq Composite to S&P 500 Index Ratio “monthly” Chart
Note that KimbleCharting is offering a 2 week Free trial to See It Market readers. Just send me an email to services@kimblechartingsolutions.com for details to get set up.
Twitter: @KimbleCharting
Any opinions expressed herein are solely those of the author, and do not in any way represent the views or opinions of any other person or entity.

")


")