As mentioned in the title, the chart of the Nasdaq 100 Index (INDEXNASDAQ:.IXIC) is showing topping formations.
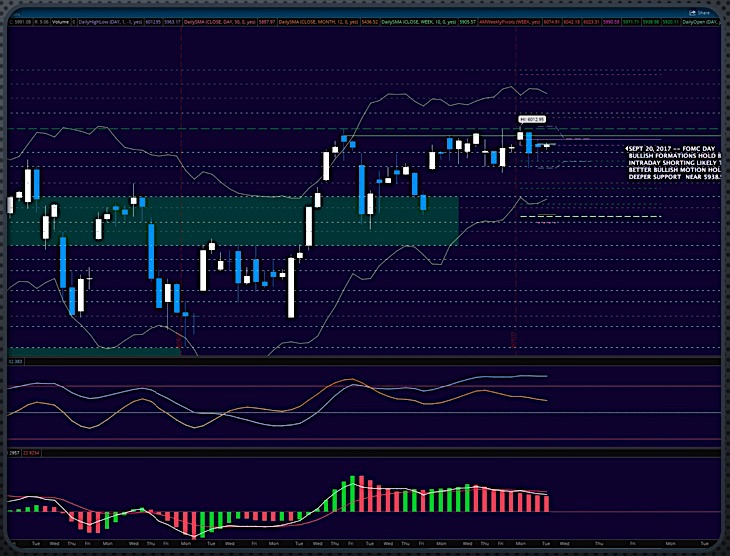
The chart below shows overhead resistance… and how momentum is beginning to stall out for large cap tech stocks.
Although pullbacks are likely to be bought, traders should use caution here. Below is a list of trading support, resistance, and insights for the coming hours of trading:
- Intraday Support 5987.
- Intraday Resistance 5999.75.
- Pullbacks are still buying events.
- Loss of 5957 will give us a deeper test into potentially 5916.
NASDAQ 100 Chart
As long as the trader keeps himself aware of support and resistance levels, risk can be very adequately managed to play in either direction as bottom picking remains a behavior pattern that is developing with value buyers and speculative traders. Thanks for reading.
Twitter: @AnneMarieTrades
The author trades stock market futures every day and may have a position in mentioned securities at the time of publication. Any opinions expressed herein are solely those of the author, and do not in any way represent the views or opinions of any other person or entity.


")
 Ready To Break Out?")
