The point of today’s Daily is to dissect the daily chart for the Pot ETF – Alternative Harvest ETF (NYSEARCA: MJ).
What made me pay attention to MJ today?
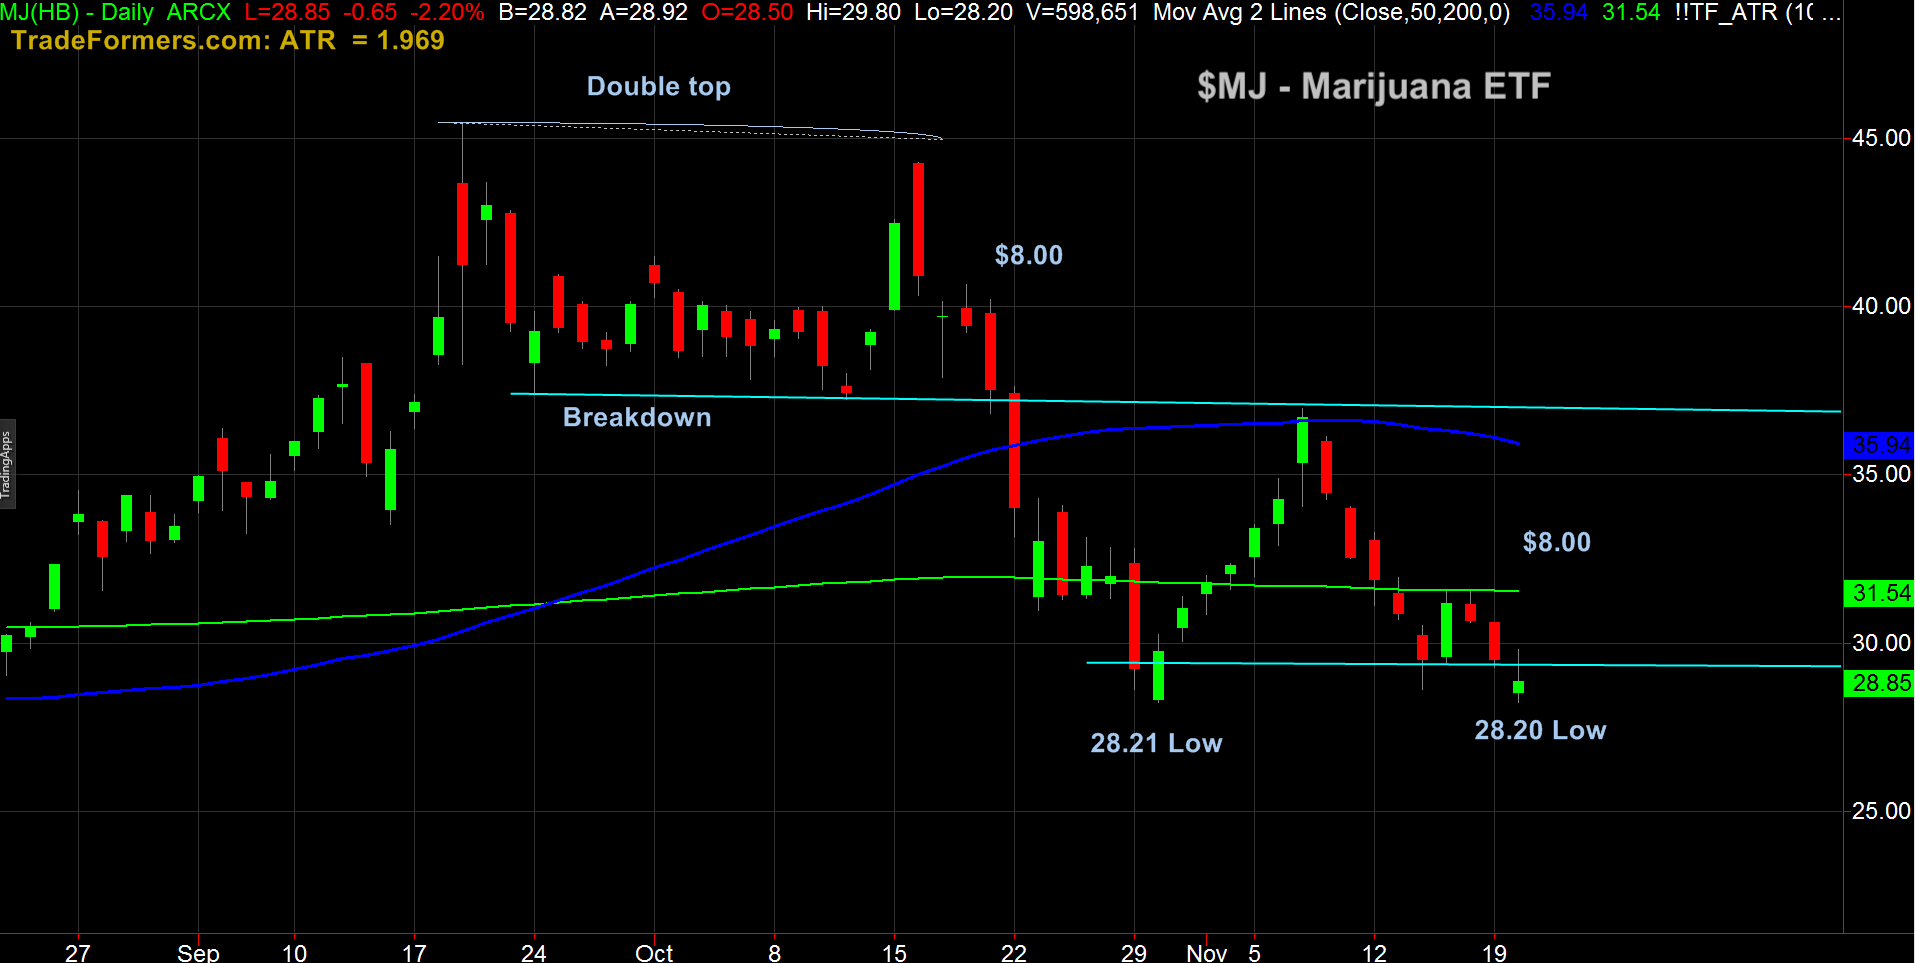
The new multi-month low posted early in the session, which is exactly one cent below the October 30th low.
That, and the megatrend of legal medical and recreational marijuana.
Plus, to acknowledge that Massachusetts began selling recreational pot legally today.
When I see a new multi-month low, and especially if that new low is so close to the former low, it could turn out to be technical perfection.
What needs to happen to make us sing, Sweet Leafby Black Sabbath?
The chart is marked “Double top” from the two highs made on September 19th and October 16th.
If you measure the “Breakdown” area under 37.21 which occurred on October 22nd, from the highs to that point, you see it is about an $8.00 move.
Typically, you subtract the number of dollars from the top of the double top, to the breakdown when that double top confirms.
Then, you subtract that same amount ($8.00) from the breakdown point to get an approximate target.
37.21 minus $8.00 is 29.21.
Clearly, MJ has overshot the target, but that is fine.
Now, considering the new multi-month low today, what do you think would be the most conservative signal to buy MJ?
If you guessed back over 29.21, congratulations.
Do you know what the risk should be?
If you guessed under 28.20 with some fudge, so let’s say 27.99, congratulations again.
If you are willing to risk $1.20, what is your first profit target?
If you said 31.60 or a 2:1 risk/reward ratio, “keep blazing and stay amazing.”
Now, if the market continues to decline and this breaks below today’s low, you will hear us singing, Mary Jane’s Last Dance by Tom Petty.
Trading levels for key stock market ETFs:
S&P 500 (SPY) – recent low 259.85. Last week’s low 267. Resistance at 267
Russell 2000 (IWM) – 150 pivotal. Recent low 144.70
Dow Jones Industrials (DIA) – Confirmed Distribution Phase-248.50 resistance. 241.05 the October low.
Nasdaq (QQQ) – Made a new multi-month low today at 157.13. Resistance now at 160.09 the October low
KRE (Regional Banks) – I’m guessing we move closer to 50 before we see 55 again.
SMH (Semiconductors) – 86.95 recent low. 90.00 pivotal
IYT (Transportation) – 186.50 now resistance with best support at 175-176.
IBB (Biotechnology) – The 200 WMA at 104.75-now resistance. 100-101-a wall of support
XRT (Retail) – 45.00 broke-now, if clears back MAYBE a rally thereafter
Twitter: @marketminute
The authors may have a position in the mentioned securities at the time of publication. Any opinions expressed herein are solely those of the author, and do not in any way represent the views or opinions of any other person or entity.


 Ready To Break Out?")


")