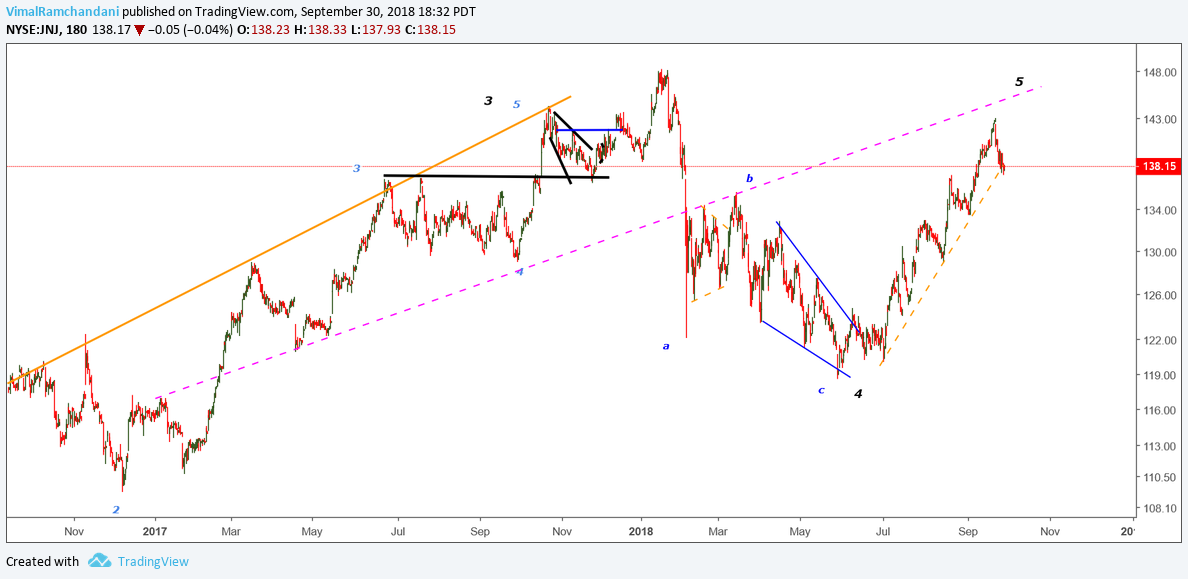
In September 2018, I called for the completion of a five wave impulsive rally on Johnson & Johnson (NYSE: JNJ) that started in May 2018.
My target was around $148.
In the first chart below, you will note that in December 2018, the stock hit a high of approximately $149 and thereafter declined very sharply to almost negate the entire price incline from May 2018.
$JNJ Johnson & Johnson Stock Chart – Sept 30
In the second chart below, we can see that the series of higher highs and higher lows are still intact and we note a very clear black trend line that has remained as a major pivot from the middle of 2015 onward.
$JNJ Johnson & Johnson Stock Chart – Current
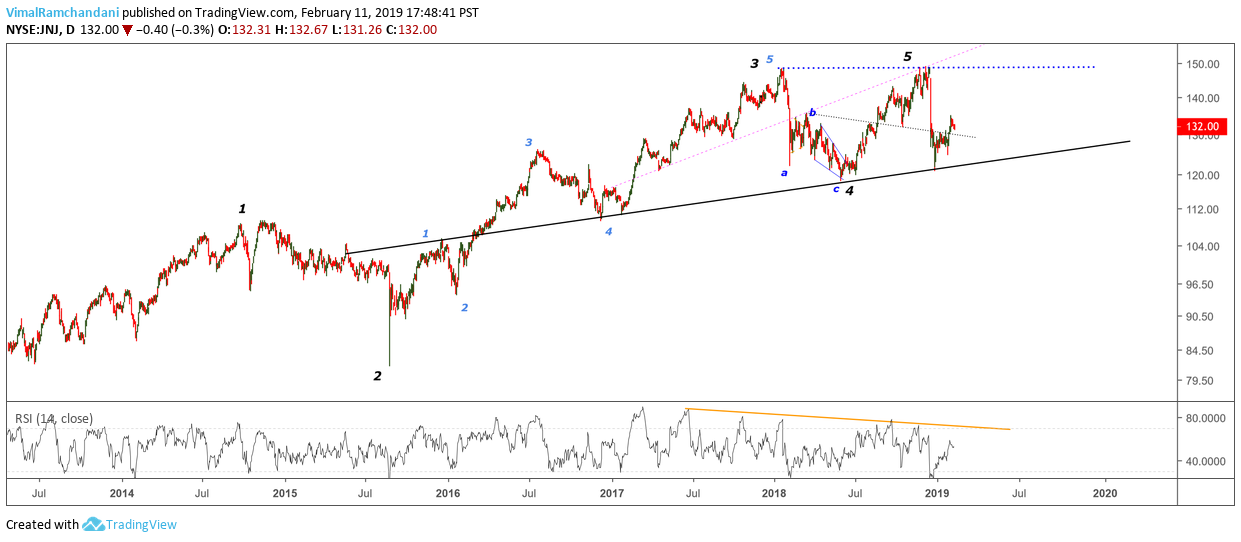
I feel that a larger impulsive five wave structure completed in December 2018. This is denoted by the numbers in black.
It looks as though we have some sort of double top formation. There is also a declining relative strength index that is accompanied by higher prices. This is known as negative divergence and indicates that momentum has slowed down as prices drifted higher.
While it must be noted that the uptrend is still intact, any close below the low made on the 24th of December and the black trend line line at $120, will most likely lead to a sharp decline in prices with a minimum target of $110. Only a close above the high made in December will negate the short term bearish structure and the double top that is currently in place.
Twitter: @vimalvr
The author does not have a position in mentioned securities at the time of publication. Any opinions expressed herein are solely those of the author, and do not in any way represent the views or opinions of any other person or entity

 Rolling Over At Key Fibonacci Level?")


 Rolling Over At Key Fibonacci Level?")
