The following is a recap of the January 27 COT Report (Commitment of Traders) released by the CFTC (Commodity Futures Trading Commission) looking at COT data and futures positions of non-commercial holdings as of January 24.
Note that the change in COT report data is week-over-week. Excerpts of this blog post also appear on Paban’s blog.
3 COT Report Charts Looking At Speculative Futures Trading Positions in Crude Oil, Gold and the US Dollar
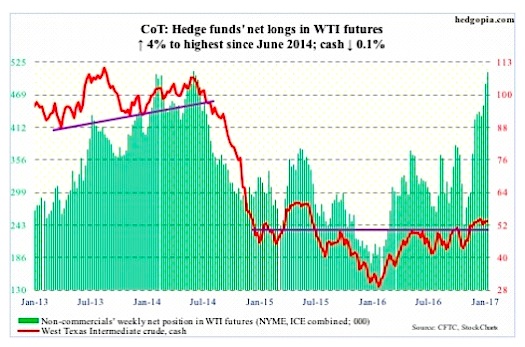
CRUDE OIL
Except for U.S. crude oil imports, which dropped 568,000 barrels per day to 7.8 million b/d, other major metrics in the weekly EIA report all leaned negative.
For the week of January 20, crude oil stocks rose 2.8 million barrels to 488.3 million barrels – a nine-week high. Gasoline stocks jumped 6.8 million barrels to 253.2 million barrels – the highest since February last year. And, distillate stocks were up 76,000 barrels to 169.1 million barrels.
Refinery utilization fell 2.4 percentage points to 88.3. Two weeks ago (93.6) was a four-month high.
Crude oil production inched up 17,000 b/d to 8.96 million barrels. This was the highest since April last year.
Wednesday, the day the EIA report came out, spot West Texas Intermediate crude oil fell, as did Monday. On Sunday news out that OPEC and non-OPEC producers had taken 1.5 million barrels per day out of the market. They had earlier agreed to output cut of 1.8 mb/d in the first half this year. Ideally, oil should have rallied on this.
From the February (2016) lows, spot WTI crude oil more than doubled, and looks fatigued. This week produced another doji – seventh in the last eight weeks.
In the meantime, non-commercials’ net longs rose to the highest since June 2014. Crude oil began a nasty drop in that month.
January 27 COT Report Data: Currently net long 507.3k, up 19.6k.
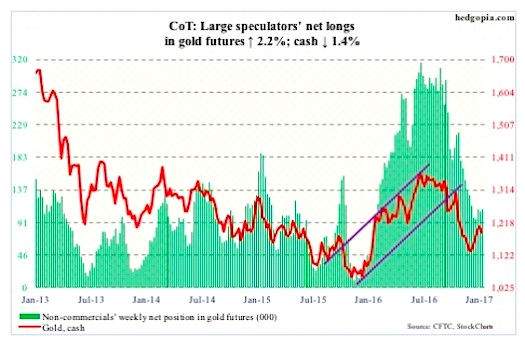
GOLD
Turns out it was an exception than a rule. In the week ended Wednesday last week the SPDR Gold ETF (NYSEARCA:GLD) attracted $115 million. This was after nine consecutive weeks of outflows totaling $5.7 billion. This week (through Wednesday), $347 million came out (courtesy of ETF.com).
The 8.9-percent rally in the cash between December 15 and January 23 was not able to coax new funds. Now, gold futures ($1,188.4/ounce) are itching to go lower.
Gold bugs need to defend $1,185, which also approximates the 50-day moving average ($1,178.43). The latter level (on gold futures) was defended on Friday.
January 27 COT Report Data: Currently net long 109.4k, up 2.4k.
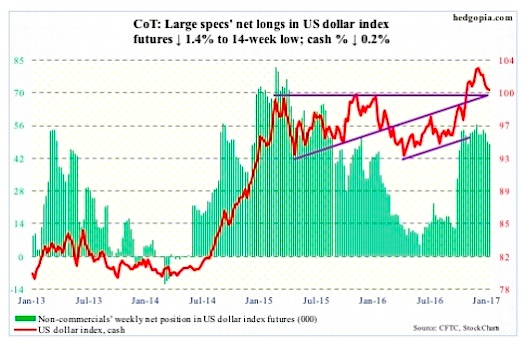
US DOLLAR INDEX
First, it was President Trump who said the strong dollar is killing U.S. companies’ ability to compete. Now, it is Treasury Secretary-nominee Steven Mnuchin who in a written response to a U.S. senator said a strong dollar may hurt the economy.
If this is not enough of a wink and a nod to the currency market as to which way the Trump administration leans, what is?
Besides overbought technicals, this is yet another roadblock to dollar bulls’ hopes for a sustained upward pressure on the US Dollar index.
Speaking of which the US Dollar Index broke out of March 2015 horizontal resistance post-election, but is struggling to save it.
A rising trend line drawn from the May 2016 low gets tested around 98.
January 27 COT Report Data: Currently net long 48.4k, down 700.
Thanks for reading.
Twitter: @hedgopia
Author may hold a position in mentioned securities at the time of publication. Any opinions expressed herein are solely those of the author, and do not in any way represent the views or opinions of any other person or entity.


")
 Rolling Over At Key Fibonacci Level?")

")
